PROTECTED SOURCE SCRIPT
업데이트됨 TrendVizPro (BETA)

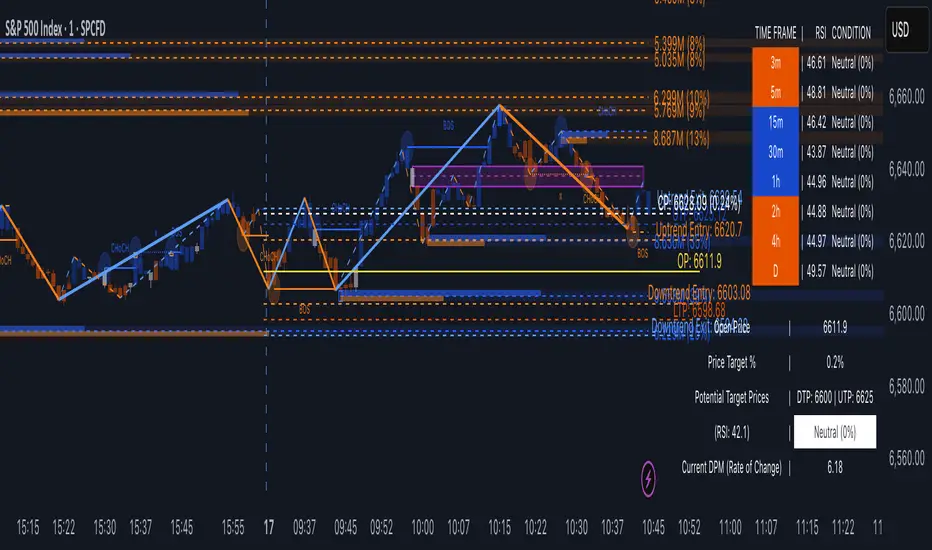
The provided script is a Pine Script code designed for TradingView that creates a sophisticated technical indicator known as “TrendVizPro (BETA).” This script performs advanced trend analysis using various tools, including candle patterns, RSI (Relative Strength Index), simple moving averages (SMA), previous-day price levels, and multi-timeframe analysis.
How to Use:
Advanced Use Cases:
Conclusion:
This indicator is a comprehensive tool designed for traders seeking to automate their trend and signal analysis. With flexible settings, it can cater to multiple trading styles, from scalping to swing trading, all within the TradingView platform.
Key Features:
- Candle Style Selection: Users can choose between traditional candlesticks or Heiken Ashi candlesticks for better visualization of trends.
- Trend Identification:Uptrend, Downtrend, and Neutral Trend conditions are determined using smoothed Heiken Ashi candles and the relationship between short and long SMAs.
The script highlights trends using customizable colors (green for uptrend, red for downtrend, white for neutral).- RSI Calculation:Calculates the RSI and indicates overbought/oversold market conditions with visual signals.
Customizable RSI lengths, overbought/oversold levels, and associated colors.- Price Targeting System:Automatically calculates potential price targets based on historical volatility, which can be overridden manually.
Upper and lower target price lines can be plotted, showing where the price might move based on historical data or user-defined percentages.- Multi-Timeframe Analysis:A table is displayed that shows the RSI, trend, and condition (overbought, oversold, or neutral) across various timeframes (3m, 5m, 15m, 30m, 1h, 2h, 4h, Daily).
The table adapts dynamically based on the data for each timeframe.- Previous Day’s High, Low, and Average:Plots lines representing the previous day’s high, low, and average price levels.
The midpoint between these values is also plotted for additional context.- Trading Signals:
- Long and short trading signals are generated based on the trend’s strength and direction.
- Exit signals are plotted to indicate potential points to exit trades.
How to Use:
- Input Settings:Candle Style: Select “Traditional Candle” or “Super Trend Heiken Ashi Candle” to choose how price data is visualized.
Trend Colors: Customize the colors for different trend conditions (Uptrend, Neutral, Downtrend).
RSI Settings: Adjust the RSI length, overbought/oversold levels, and corresponding signal colors.
Price Target: Toggle the autopilot mode to use historical data to calculate potential price targets, or manually input a percentage for custom target prices.
Table and Signal Visibility: Decide whether to display the multi-timeframe analysis table, open price, previous day levels, and various trading signals (long, short, exit). - Analyzing the Chart:When applied to a chart, the indicator plots different price levels (open price, previous day levels, target prices) using lines.
The current trend is displayed via candle colors, and uptrend/downtrend signals are shown on the chart using arrows (long or short positions).
The multi-timeframe table provides a quick overview of trend and RSI conditions for different timeframes. - Signal Use:Long Signals: Indicated by green arrows below bars, suggesting a strong uptrend.
Short Signals: Indicated by red arrows above bars, signaling a strong downtrend.
Exit Signals: Marked with X symbols, indicating when to consider exiting a long or short position. - Trend Entry and Exit:Trend Entry/Exit Lines: When activated, orange lines mark optimal trend entry points, and blue lines show potential trend exit points.
- Customizable Visuals:
- The background color and plot styles (dashed lines, solid lines, labels) are customizable to make the chart more visually distinct and easy to interpret.
- The background color and plot styles (dashed lines, solid lines, labels) are customizable to make the chart more visually distinct and easy to interpret.
Advanced Use Cases:
- Multi-Timeframe Traders: Use the multi-timeframe analysis table to check how trends and RSI values behave across different intervals, helping to identify key support/resistance levels or trend continuation points.
- Intraday Trading: The script is highly effective for day traders, as it allows visualization of important intraday levels, such as previous highs/lows and current trend conditions.
- Swing Trading: Swing traders can leverage the autopilot price target feature to identify optimal exit points based on historical price behavior.
Conclusion:
This indicator is a comprehensive tool designed for traders seeking to automate their trend and signal analysis. With flexible settings, it can cater to multiple trading styles, from scalping to swing trading, all within the TradingView platform.
릴리즈 노트
Added features 릴리즈 노트
Added features 릴리즈 노트
Added features 릴리즈 노트
Update릴리즈 노트
Zigzag High and Low added릴리즈 노트
Update보호된 스크립트입니다
이 스크립트는 비공개 소스로 게시됩니다. 하지만 이를 자유롭게 제한 없이 사용할 수 있습니다 – 자세한 내용은 여기에서 확인하세요.
면책사항
해당 정보와 게시물은 금융, 투자, 트레이딩 또는 기타 유형의 조언이나 권장 사항으로 간주되지 않으며, 트레이딩뷰에서 제공하거나 보증하는 것이 아닙니다. 자세한 내용은 이용 약관을 참조하세요.
보호된 스크립트입니다
이 스크립트는 비공개 소스로 게시됩니다. 하지만 이를 자유롭게 제한 없이 사용할 수 있습니다 – 자세한 내용은 여기에서 확인하세요.
면책사항
해당 정보와 게시물은 금융, 투자, 트레이딩 또는 기타 유형의 조언이나 권장 사항으로 간주되지 않으며, 트레이딩뷰에서 제공하거나 보증하는 것이 아닙니다. 자세한 내용은 이용 약관을 참조하세요.