OPEN-SOURCE SCRIPT
DVRSI Premium (Força + EMA50 + Volume) - by Patrick
Best uses
Entry confirmation: Avoids trading based only on RSI or moving averages, requiring multiple criteria (strength, trend, and volume). May require that you zoom in for best views.
Automatic alerts: Useful for traders who cannot monitor charts constantly — alerts notify when a confirmed signal appears.
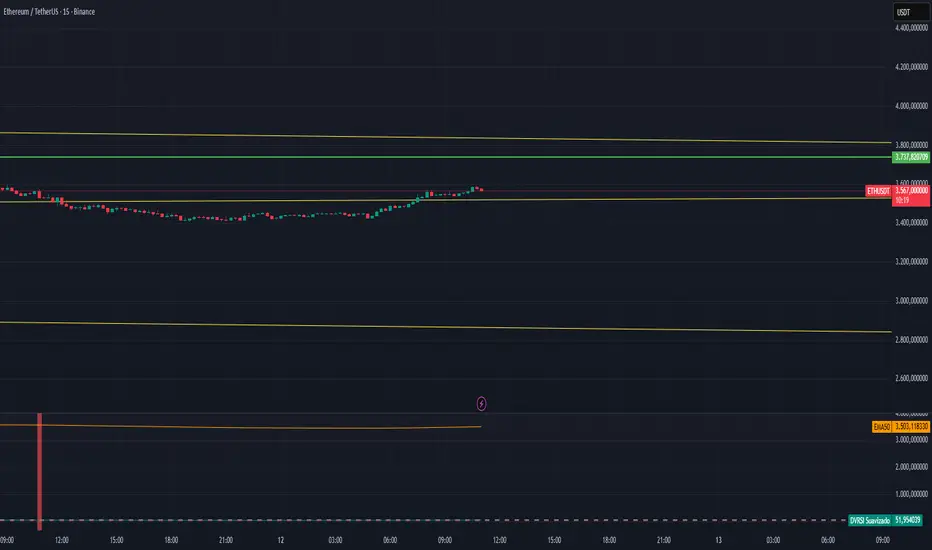
How the script works
Inputs
RSI with 21 periods (smoothed RSI to reduce noise)
20‑period moving average of volume.
50‑period exponential moving average.
Calculates the size of the candle body, compares it with the average body size
Defines a candle as “strong” if:
Body > 1.5 × average body size.
Volume > 1.3 × average volume.
Trend and strength conditions
crossUp → smoothed RSI crosses above the 50 line.
crossDown → smoothed RSI crosses below the 50 line.
volumeHigh → volume above average.
upTrend → price above EMA50.
downTrend → price below EMA50.
Signals
LONG (buy): RSI crosses above 50 + high volume + price above EMA50 + strong candle.
SHORT (sell): RSI crosses below 50 + high volume + price below EMA50 + strong candle.
Alerts - Creates automatic alerts for confirmed LONG and SHORT signals, with descriptive messages.
Visualization - Plots Smoothed RSI, EMA50 nad Horizontal lines (40, 50, 60) as reference zones.
Chart background changes color:
Green when there is a LONG signal.
Red when there is a SHORT signal.
Entry confirmation: Avoids trading based only on RSI or moving averages, requiring multiple criteria (strength, trend, and volume). May require that you zoom in for best views.
Automatic alerts: Useful for traders who cannot monitor charts constantly — alerts notify when a confirmed signal appears.
How the script works
Inputs
RSI with 21 periods (smoothed RSI to reduce noise)
20‑period moving average of volume.
50‑period exponential moving average.
Calculates the size of the candle body, compares it with the average body size
Defines a candle as “strong” if:
Body > 1.5 × average body size.
Volume > 1.3 × average volume.
Trend and strength conditions
crossUp → smoothed RSI crosses above the 50 line.
crossDown → smoothed RSI crosses below the 50 line.
volumeHigh → volume above average.
upTrend → price above EMA50.
downTrend → price below EMA50.
Signals
LONG (buy): RSI crosses above 50 + high volume + price above EMA50 + strong candle.
SHORT (sell): RSI crosses below 50 + high volume + price below EMA50 + strong candle.
Alerts - Creates automatic alerts for confirmed LONG and SHORT signals, with descriptive messages.
Visualization - Plots Smoothed RSI, EMA50 nad Horizontal lines (40, 50, 60) as reference zones.
Chart background changes color:
Green when there is a LONG signal.
Red when there is a SHORT signal.
오픈 소스 스크립트
트레이딩뷰의 진정한 정신에 따라, 이 스크립트의 작성자는 이를 오픈소스로 공개하여 트레이더들이 기능을 검토하고 검증할 수 있도록 했습니다. 작성자에게 찬사를 보냅니다! 이 코드는 무료로 사용할 수 있지만, 코드를 재게시하는 경우 하우스 룰이 적용된다는 점을 기억하세요.
면책사항
해당 정보와 게시물은 금융, 투자, 트레이딩 또는 기타 유형의 조언이나 권장 사항으로 간주되지 않으며, 트레이딩뷰에서 제공하거나 보증하는 것이 아닙니다. 자세한 내용은 이용 약관을 참조하세요.
오픈 소스 스크립트
트레이딩뷰의 진정한 정신에 따라, 이 스크립트의 작성자는 이를 오픈소스로 공개하여 트레이더들이 기능을 검토하고 검증할 수 있도록 했습니다. 작성자에게 찬사를 보냅니다! 이 코드는 무료로 사용할 수 있지만, 코드를 재게시하는 경우 하우스 룰이 적용된다는 점을 기억하세요.
면책사항
해당 정보와 게시물은 금융, 투자, 트레이딩 또는 기타 유형의 조언이나 권장 사항으로 간주되지 않으며, 트레이딩뷰에서 제공하거나 보증하는 것이 아닙니다. 자세한 내용은 이용 약관을 참조하세요.