OPEN-SOURCE SCRIPT
Rainbow MA- AYNET
Description
What it Does:
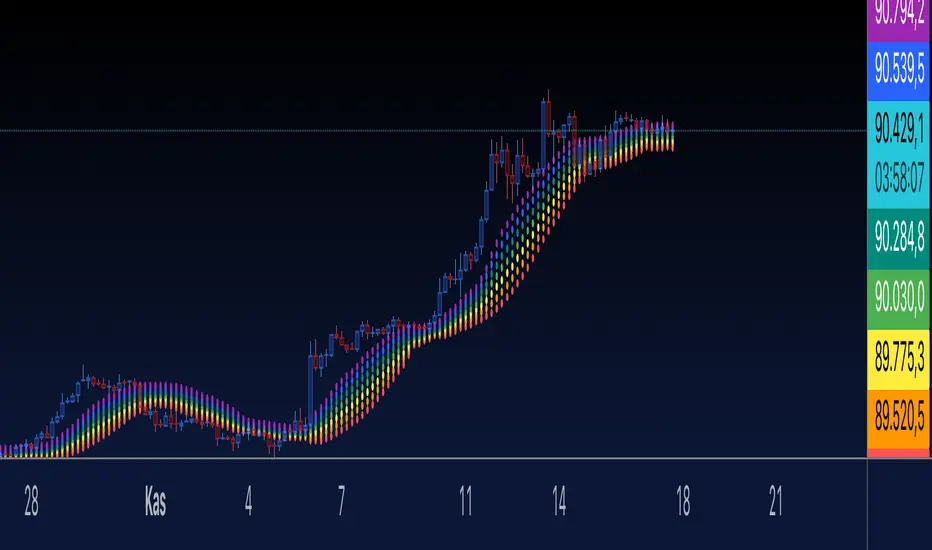
The Rainbow Indicator visualizes price action with a colorful "rainbow-like" effect.
It uses a moving average (SMA) and dynamically creates bands around it using standard deviation.
Features:
Seven bands are plotted, each corresponding to a different rainbow color (red to purple).
Each band is calculated using the moving average (ta.sma) and a smoothing multiplier (smooth) to control their spread.
User Inputs:
length: The length of the moving average (default: 14).
smooth: Controls the spacing between the bands (default: 0.5).
radius: Adjusts the size of the circular points (default: 3).
How it Works:
The bands are plotted above and below the moving average.
The offset for each band is calculated using standard deviation and a user-defined smoothing multiplier.
Plotting:
Each rainbow band is plotted individually using plot() with circular points (plot.style_circles).
Customization
You can modify the color palette, adjust the smoothing multiplier, or change the moving average length to suit your needs.
The number of bands can also be increased or decreased by adding/removing colors from the colors array and updating the loop.
If you have further questions or want to extend the indicator, let me know! 😊
What it Does:
The Rainbow Indicator visualizes price action with a colorful "rainbow-like" effect.
It uses a moving average (SMA) and dynamically creates bands around it using standard deviation.
Features:
Seven bands are plotted, each corresponding to a different rainbow color (red to purple).
Each band is calculated using the moving average (ta.sma) and a smoothing multiplier (smooth) to control their spread.
User Inputs:
length: The length of the moving average (default: 14).
smooth: Controls the spacing between the bands (default: 0.5).
radius: Adjusts the size of the circular points (default: 3).
How it Works:
The bands are plotted above and below the moving average.
The offset for each band is calculated using standard deviation and a user-defined smoothing multiplier.
Plotting:
Each rainbow band is plotted individually using plot() with circular points (plot.style_circles).
Customization
You can modify the color palette, adjust the smoothing multiplier, or change the moving average length to suit your needs.
The number of bands can also be increased or decreased by adding/removing colors from the colors array and updating the loop.
If you have further questions or want to extend the indicator, let me know! 😊
오픈 소스 스크립트
트레이딩뷰의 진정한 정신에 따라, 이 스크립트의 작성자는 이를 오픈소스로 공개하여 트레이더들이 기능을 검토하고 검증할 수 있도록 했습니다. 작성자에게 찬사를 보냅니다! 이 코드는 무료로 사용할 수 있지만, 코드를 재게시하는 경우 하우스 룰이 적용된다는 점을 기억하세요.
면책사항
해당 정보와 게시물은 금융, 투자, 트레이딩 또는 기타 유형의 조언이나 권장 사항으로 간주되지 않으며, 트레이딩뷰에서 제공하거나 보증하는 것이 아닙니다. 자세한 내용은 이용 약관을 참조하세요.
오픈 소스 스크립트
트레이딩뷰의 진정한 정신에 따라, 이 스크립트의 작성자는 이를 오픈소스로 공개하여 트레이더들이 기능을 검토하고 검증할 수 있도록 했습니다. 작성자에게 찬사를 보냅니다! 이 코드는 무료로 사용할 수 있지만, 코드를 재게시하는 경우 하우스 룰이 적용된다는 점을 기억하세요.
면책사항
해당 정보와 게시물은 금융, 투자, 트레이딩 또는 기타 유형의 조언이나 권장 사항으로 간주되지 않으며, 트레이딩뷰에서 제공하거나 보증하는 것이 아닙니다. 자세한 내용은 이용 약관을 참조하세요.