OPEN-SOURCE SCRIPT
업데이트됨 ema exhaustion (exa)
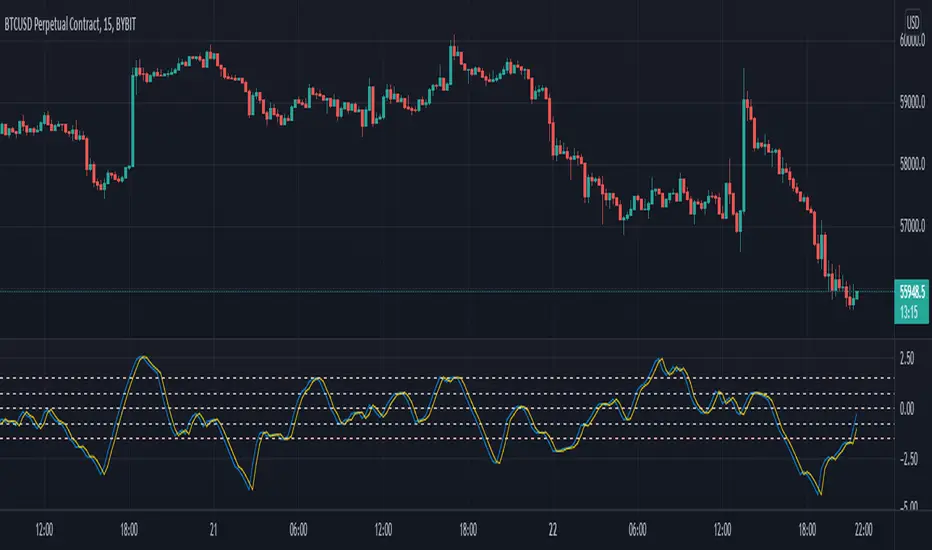
The exa is an oscillator that combines fisher transform with distance from moving average and it is based on a theory that exhaustion can be derived from how far price is able to extend from a moving average, on average.
The fisher transform converts price into a gaussian normal distribution, also known as a bell curve {1}. A normal distribution is a type of probability distribution for a real-valued random variable {2}. Applying this method to the price of an asset can help to identify probabilities, but it will never identify certainties.
‘exa’ is an abbreviation for ema exhaustion. It can be used to identify when price is probable to revert to the mean but I prefer using it to confirm entries that are signaled following a reversion to the mean (aka buying the dip in bull markets). When price gets oversold into support, in a bull trend, then that can provide a good opportunity to enter long. However that isn’t necessarily the case when the same metrics indicate oversold conditions in a bear trend. In this situation the exa is best suited for identifying profit taking opportunities on shorts.
The default settings are a 9 lookback period and a 50 ema. By default signals will be derived from how far price is from the 50 ema relative to the probable distribution of the last 9 periods. If the exa is above 2, or below -2, then the price is in the 80th percentile of the prior 9 candles. Being outside of 3, or -3, represents the 90th percentile and 4, or -4, represents the 95th percentile.
Those ranges will never indicate a necessity of reverting to the mean, but they will indicate a higher and higher probability. I prefer to use this oscillator in combination with an indicator(s) that identifies the trend. When the oscillator reaches -2 in a bull trend then it can confirm long entry signals, whereas if it reaches +2 in a bull trend then it can be used to confirm signals to take profit.
Crossovers are especially significant because they indicate a shift in the tide. When the exa reaches 2 without crossing over then it is very much in a position to move to 3 or 4+. When it crosses above 2 then it is an indication that price is extended from the mean and exhausted.
This is certainly not a situation that implies price will revert to the mean, it simply provides confirmation.
The default settings are what I have been finding most effective personally, however that is mostly a function of the trend following tools that I use. The same principles should apply with all settings and I would encourage users to experiment with various lookback periods and emas.
{1} investopedia.com/terms/f/fisher-transform.asp
{2} en.wikipedia.org/wiki/Normal_distribution
릴리즈 노트
Fixed bug where chart flat-lined for some pairs with prices less than 1.오픈 소스 스크립트
트레이딩뷰의 진정한 정신에 따라, 이 스크립트의 작성자는 이를 오픈소스로 공개하여 트레이더들이 기능을 검토하고 검증할 수 있도록 했습니다. 작성자에게 찬사를 보냅니다! 이 코드는 무료로 사용할 수 있지만, 코드를 재게시하는 경우 하우스 룰이 적용된다는 점을 기억하세요.
emasar Indicator is available for purchase at alphanalysis.io/product/emasar/
면책사항
해당 정보와 게시물은 금융, 투자, 트레이딩 또는 기타 유형의 조언이나 권장 사항으로 간주되지 않으며, 트레이딩뷰에서 제공하거나 보증하는 것이 아닙니다. 자세한 내용은 이용 약관을 참조하세요.
오픈 소스 스크립트
트레이딩뷰의 진정한 정신에 따라, 이 스크립트의 작성자는 이를 오픈소스로 공개하여 트레이더들이 기능을 검토하고 검증할 수 있도록 했습니다. 작성자에게 찬사를 보냅니다! 이 코드는 무료로 사용할 수 있지만, 코드를 재게시하는 경우 하우스 룰이 적용된다는 점을 기억하세요.
emasar Indicator is available for purchase at alphanalysis.io/product/emasar/
면책사항
해당 정보와 게시물은 금융, 투자, 트레이딩 또는 기타 유형의 조언이나 권장 사항으로 간주되지 않으며, 트레이딩뷰에서 제공하거나 보증하는 것이 아닙니다. 자세한 내용은 이용 약관을 참조하세요.