OPEN-SOURCE SCRIPT
업데이트됨 20-34 Dual Dot Alerts Only
Pine Script that uses dual Donchian Channels (20-period and 34-period) and places tiny blue dots above candles when the highest price touches any upper Donchian Channel and below candles when the lowest price touches any lower Donchian Channel, without displaying the channels themselves, you can use the code.
### Explanation of the Code:
1. **Indicator Declaration**: The script is named "Dual Donchian Channels Dots Only" and overlays on the price chart.
2. **Input for Lengths**: Users can set lengths for two Donchian Channels (20 and 34 periods).
3. **Calculating Bands**: The upper and lower bands are calculated using `ta.highest` and `ta.lowest` functions over the specified periods.
4. **Touch Conditions**:
- `upperTouch`: Checks if the highest price of the current candle touches either of the upper bands.
- `lowerTouch`: Checks if the lowest price of the current candle touches either of the lower bands.
5. **Plotting Dots**:
- A tiny blue dot is plotted above bars where `upperTouch` is true.
- A tiny blue dot is plotted below bars where `lowerTouch` is true.
### How to Use:
1. Copy this script into TradingView’s Pine Script editor.
2. Save it and add it to your chart.
3. You will see tiny blue dots appear above or below candles based on whether they touch any of the upper or lower Donchian Bands.
This setup provides a clear visual indication of price interactions with both Donchian Channels while keeping the chart uncluttered by hiding the channel lines.
릴리즈 노트
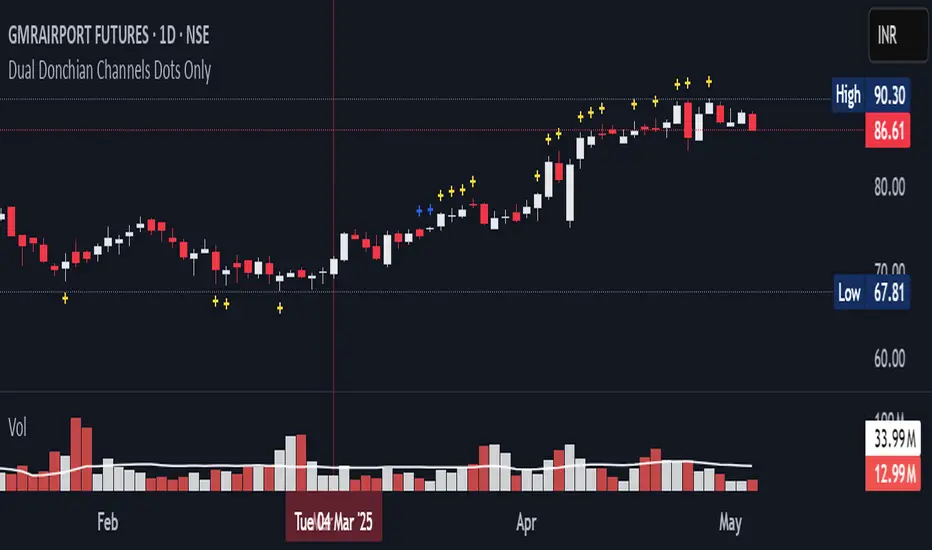
Spot key price reactions with clean, minimalist signals when price tests single or dual Donchian Channel boundaries.🔍 Overview
This indicator identifies potential reversal zones by plotting discrete dots when price touches:
Single Donchian Channel (20-period or 34-period extremes → Blue dots)
Double Donchian Channel (20-period and 34-period extremes → Yellow dots)
Perfect for traders who want:
✅ Visual clarity – No cluttered lines, only actionable dots.
✅ Multi-timeframe confirmation – Dual-channel touches highlight stronger levels.
✅ Customizable periods – Adapt to any trading style (intraday/swing).
릴리즈 노트
Earlier script had some errors. They have been now fixed.오픈 소스 스크립트
트레이딩뷰의 진정한 정신에 따라, 이 스크립트의 작성자는 이를 오픈소스로 공개하여 트레이더들이 기능을 검토하고 검증할 수 있도록 했습니다. 작성자에게 찬사를 보냅니다! 이 코드는 무료로 사용할 수 있지만, 코드를 재게시하는 경우 하우스 룰이 적용된다는 점을 기억하세요.
Learning smoothly & executing confidently.
면책사항
해당 정보와 게시물은 금융, 투자, 트레이딩 또는 기타 유형의 조언이나 권장 사항으로 간주되지 않으며, 트레이딩뷰에서 제공하거나 보증하는 것이 아닙니다. 자세한 내용은 이용 약관을 참조하세요.
오픈 소스 스크립트
트레이딩뷰의 진정한 정신에 따라, 이 스크립트의 작성자는 이를 오픈소스로 공개하여 트레이더들이 기능을 검토하고 검증할 수 있도록 했습니다. 작성자에게 찬사를 보냅니다! 이 코드는 무료로 사용할 수 있지만, 코드를 재게시하는 경우 하우스 룰이 적용된다는 점을 기억하세요.
Learning smoothly & executing confidently.
면책사항
해당 정보와 게시물은 금융, 투자, 트레이딩 또는 기타 유형의 조언이나 권장 사항으로 간주되지 않으며, 트레이딩뷰에서 제공하거나 보증하는 것이 아닙니다. 자세한 내용은 이용 약관을 참조하세요.