OPEN-SOURCE SCRIPT
업데이트됨 Trend Counter
TREND COUNTER is a Trend Exhaustion Indicator that tracks the persistence of price movements over a series of bars, helping traders identify potential trend exhaustion and reversals.
It compares each bar's value (typically the closing price) to a previous bar from a set lookback period (the lookback bar), counting consecutive bullish or bearish price movements.
The count resets when the trend reverses, signaling a potential shift in momentum.
• Price movement is considered bullish if the current price exceeds the lookback bar's price, incrementing the bullish count with each consecutive occurrence.
• Price movement is considered bearish if the current price is lower than the lookback bar's price, incrementing the bearish count with each consecutive occurrence.
• The count resets when the trend reverses.
• The user sets the threshold for sequence resets by defining the maximum number of consecutive occurrences.
• The count may reset before a trend reversal if it surpasses the user-defined threshold.
This type of indicator is useful for detecting trends, trend exhaustion, overbought or oversold conditions, and potential reversal points, helping traders anticipate market turns.
• Sequential occurrences gauge trend strength.
A long sequence of bullish bars suggests strong upward momentum, while consecutive bearish bars indicate sustained downward pressure.
This helps traders assess whether a trend is likely to continue or weaken.
• Identify thresholds for potential reversal points.
Counting consecutive bullish or bearish price movements can highlight overextended trends.
A trend reaching a predefined threshold may signal an upcoming reversal or momentum slowdown.
• Identify potential entry or exit points.
If trends are showing signs of exhaustion after a certain number of consecutive price movements, traders may use this for timing adjustments to their position.
• Assess risk.
Understanding trend strength helps traders better adjust stop-loss or take-profit levels.
Sequential counting provides a structured approach to trade management.
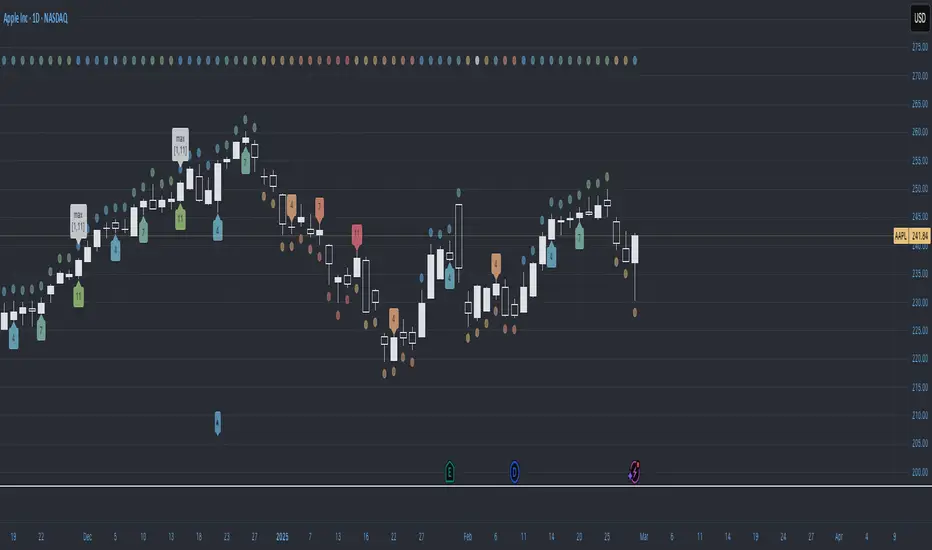
Visualization & Customization
The Sequential Momentum indicator visually represents consecutive bullish or bearish price movements to define trends and highlight key shifts.
• The bullish/bearish bar sequences are based on user-defined thresholds.
• Customizable bar coloring, labels, and plot shapes enhanced trend visualization.
• Dynamic color transitions make trend shifts easily identifiable.
Tracking consecutive bullish or bearish price movements can be effective when combined with other indicators or applied in specific market conditions (e.g., trending or volatile markets).
However, its reliability depends on market conditions and the trader’s interpretation.
This indicator is best used as a complementary tool rather than a standalone signal, helping traders visualize and quantify market momentum within a broader strategy.
It compares each bar's value (typically the closing price) to a previous bar from a set lookback period (the lookback bar), counting consecutive bullish or bearish price movements.
The count resets when the trend reverses, signaling a potential shift in momentum.
• Price movement is considered bullish if the current price exceeds the lookback bar's price, incrementing the bullish count with each consecutive occurrence.
• Price movement is considered bearish if the current price is lower than the lookback bar's price, incrementing the bearish count with each consecutive occurrence.
• The count resets when the trend reverses.
• The user sets the threshold for sequence resets by defining the maximum number of consecutive occurrences.
• The count may reset before a trend reversal if it surpasses the user-defined threshold.
This type of indicator is useful for detecting trends, trend exhaustion, overbought or oversold conditions, and potential reversal points, helping traders anticipate market turns.
• Sequential occurrences gauge trend strength.
A long sequence of bullish bars suggests strong upward momentum, while consecutive bearish bars indicate sustained downward pressure.
This helps traders assess whether a trend is likely to continue or weaken.
• Identify thresholds for potential reversal points.
Counting consecutive bullish or bearish price movements can highlight overextended trends.
A trend reaching a predefined threshold may signal an upcoming reversal or momentum slowdown.
• Identify potential entry or exit points.
If trends are showing signs of exhaustion after a certain number of consecutive price movements, traders may use this for timing adjustments to their position.
• Assess risk.
Understanding trend strength helps traders better adjust stop-loss or take-profit levels.
Sequential counting provides a structured approach to trade management.
Visualization & Customization
The Sequential Momentum indicator visually represents consecutive bullish or bearish price movements to define trends and highlight key shifts.
• The bullish/bearish bar sequences are based on user-defined thresholds.
• Customizable bar coloring, labels, and plot shapes enhanced trend visualization.
• Dynamic color transitions make trend shifts easily identifiable.
Tracking consecutive bullish or bearish price movements can be effective when combined with other indicators or applied in specific market conditions (e.g., trending or volatile markets).
However, its reliability depends on market conditions and the trader’s interpretation.
This indicator is best used as a complementary tool rather than a standalone signal, helping traders visualize and quantify market momentum within a broader strategy.
릴리즈 노트
Added:1) Volume Surge Labels
2) Manual Count Reset
릴리즈 노트
Fixed typo.릴리즈 노트
Fixed code error.릴리즈 노트
Repaired an error in the volume surge section of code.릴리즈 노트
1. Added improved management of neutral conditions (source == source[lookback]).2. Add a tolerance to sustain or hinder trend continuation.
릴리즈 노트
1. Added signals for days above/below a specified moving average, for example, days above the 10-day EMA.릴리즈 노트
Added VIX > VIX3M Backwardation SignalCONTANGO
Definition: A market condition where longer-term futures or volatility indices trade at higher levels than shorter-term ones, reflecting an upward-sloping term structure.
VIX9D < Spot VIX < VIX3M < VIX6M < VIX1Y during stable markets.
Contango occurs in a normal, calm market. Volatility expectations increase with time due to uncertainty, so longer-term indices (e.g., VIX1Y) are higher than shorter-term ones (e.g., Spot VIX).
Implication: Indicates stability or low immediate fear, with higher costs for hedging further out.
BACKWARDATION
Definition: A market condition where shorter-term futures or volatility indices are higher than longer-term ones, reflecting a downward-sloping term structure.
Spot VIX > VIX3M > VIX6M > VIX1Y during periods of heightened uncertainty or panic, or even VIX9D > Spot VIX in extreme short-term panic.
Backwardation occurs during periods of heightened near-term uncertainty or panic, where immediate volatility (e.g., Spot VIX) spikes above longer-term expectations (e.g., VIX6M).
Implication: Often a contrarian buy signal for equities, as extreme near-term fear may signal a market bottom.
VIX CALCULATIONS
The CBOE VIX indices measure annualized implied volatility based on S&P 500 (SPX) option prices. Here’s how it’s calculated step-by-step:
Step 1: Gather Option Prices. Collect the prices of out-of-the-money (OTM) SPX put and call options for a specific expiration period.
• Puts with strike prices below the current SPX forward price.
• Calls with strike prices above the current SPX forward price.
Step 2: Determine Key Variables
• T: Time to expiration in years (e.g., 30 days / 365 = 0.0822 years for Spot VIX).
• F: Forward SPX price, derived from the strike price where the put and call prices are closest in value.
• K0: The strike price just below F (the "at-the-money" reference point).
• Ki: Each option’s strike price in the basket.
• ΔKi: The difference between consecutive strike prices (e.g., if strikes are 4000 and 4010, ΔKi = 10).
• R: Risk-free interest rate (e.g., based on U.S. Treasury yields for the expiration period).
• Q(Ki): Midpoint price of the option at strike Ki.
Step 3: Calculate Variance Contribution
For each option (put or call), compute its contribution to variance:
Contribution = (ΔKi / Ki^2) * e^(R * T) * Q(Ki)
Where:
• ΔKi / Ki^2: Weights the option by its strike price (lower strikes contribute more).
• e^(R * T): Adjusts for the time value of money using the risk-free rate.
• Q(Ki): The option’s price.
Sum these contributions across all OTM puts and calls:
Sum = (2 / T) * [Sum of all (ΔKi / Ki^2) * e^(R * T) * Q(Ki)]
Step 4: Adjust for Forward Price
Calculate a correction term based on the difference between the forward price and the at-the-money strike:
Correction = (1 / T) * [(F / K0) - 1]^2
Subtract this from the sum:
Variance = Sum - Correction
Or, fully written:
Variance = (2 / T) * [Sum of (ΔKi / Ki^2) * e^(R * T) * Q(Ki)] - (1 / T) * [(F / K0) - 1]^2
Step 5: Convert to Volatility
Take the square root of the variance and annualize it:
VIX = 100 * SquareRoot(Variance)
This gives the VIX value as an annualized percentage.
Interpolation (When Needed)
If the target horizon (e.g., 30 days) doesn’t match an exact option expiration:
Calculate variance for two nearby expirations (e.g., 23 days and 37 days).
Interpolate linearly:
Variance_30days = w1 * Variance_23days + w2 * Variance_37days
Where:
• w1 and w2 are weights based on days (e.g., w1 = (37-30)/(37-23), w2 = (30-23)/(37-23)).
Then apply Step 5 to the interpolated variance.
Spot VIX (30-day VIX):
• Definition: The Spot VIX, officially the CBOE Volatility Index (VIX), measures the market’s expectation of 30-day implied volatility of the S&P 500.
• Options: Derived from near-term and next-term SPX options (e.g., 23-day and 37-day expirations) to interpolate a constant 30-day horizon.
• T: 30 days / 365 = 0.0822 years.
VIX3M (3-month Volatility Index):
• Definition: Measures the expected 3-month (approximately 90-day) implied volatility of the S&P 500.
• Options: Derived from SPX options expiring around 90 days (e.g., 85-day and 95-day, interpolated if needed).
• T: 90 days / 365 = 0.2466 years.
VIX6M (6-month Volatility Index):
• Definition: Measures the expected 6-month (approximately 180-day) implied volatility of the S&P 500.
• Options: Derived from SPX options expiring around 180 days (e.g., 175-day and 185-day, interpolated if needed).
• T: 180 days / 365 = 0.4932 years.
릴리즈 노트
Added toggles to top of settings to allow quick display or hiding of indicator features.릴리즈 노트
Improved the VIX backwardation signals.Added more features customization.
Moving Average vs price signal can now reference any ticker, not only the charted ticker.
오픈 소스 스크립트
트레이딩뷰의 진정한 정신에 따라, 이 스크립트의 작성자는 이를 오픈소스로 공개하여 트레이더들이 기능을 검토하고 검증할 수 있도록 했습니다. 작성자에게 찬사를 보냅니다! 이 코드는 무료로 사용할 수 있지만, 코드를 재게시하는 경우 하우스 룰이 적용된다는 점을 기억하세요.
면책사항
해당 정보와 게시물은 금융, 투자, 트레이딩 또는 기타 유형의 조언이나 권장 사항으로 간주되지 않으며, 트레이딩뷰에서 제공하거나 보증하는 것이 아닙니다. 자세한 내용은 이용 약관을 참조하세요.
오픈 소스 스크립트
트레이딩뷰의 진정한 정신에 따라, 이 스크립트의 작성자는 이를 오픈소스로 공개하여 트레이더들이 기능을 검토하고 검증할 수 있도록 했습니다. 작성자에게 찬사를 보냅니다! 이 코드는 무료로 사용할 수 있지만, 코드를 재게시하는 경우 하우스 룰이 적용된다는 점을 기억하세요.
면책사항
해당 정보와 게시물은 금융, 투자, 트레이딩 또는 기타 유형의 조언이나 권장 사항으로 간주되지 않으며, 트레이딩뷰에서 제공하거나 보증하는 것이 아닙니다. 자세한 내용은 이용 약관을 참조하세요.