INVITE-ONLY SCRIPT
업데이트됨 Bitcoin Value Capture Heatmap
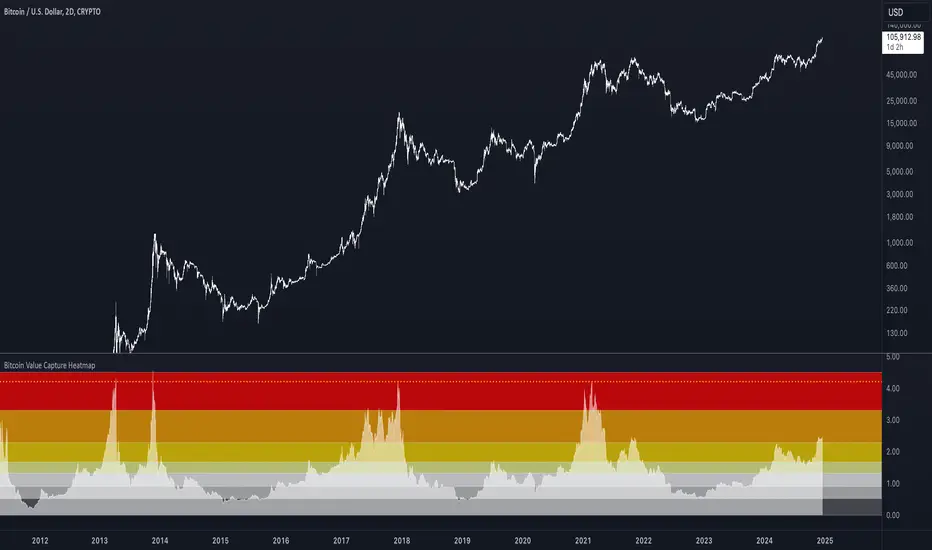
BTC Value Capture Heatmap answers a question originally posed by Willy Woo:
"How much pressure on Bitcoin's market cap does one dollar of purchasing power exert?"
The higher the print, the more market cap grows per dollar invested -- adjusted for global M2 growth.
Bitcoin Value Capture Heatmap = ( market cap / global M2 ) / realized cap
A NOVEL INGREDIENT REVEALS A UNIQUE USE CASE
Adjusting bitcoin's market cap for global M2 growth sharpens a legacy metric with a normalizing factor that 'stabilizes' its view across cycles.
The metric peaked at identical levels (4.2), three bitcoin bull markets in a row. On the same day bitcoin price volatility peaked for the cycle, every time.
One might naturally expect this to coincide with cycle tops. But it doesn't.
It precede's cycle's tops: in a consistent, very specific way, that predisposing a unique use case.

BITCOIN'S VOLATILTY TOP
The metric's true use case only comes into clear focus when paired with an unrelated insight:
Whether in distribution (in Spring 2021) or a parabolic blow off top (2017 & 2013), each of the last 3 bitcoin cycle tops shows tight consistent adherence to the Wykoff Distribution Schematic.

"But Wykoff schematics apply to distribution tops, not to blow off tops."
A closer look at the last 15-20 years of parabolic blow off tops, across all asset classes, viewed through a Wykoff lens, reveals recurring tight adherence to Wykoff's Distribution Schematic.
Including (and especially) BTC's parabolic top in Dec 2017; BTC's parabolic top in 2013; and ETH's blow off top in Jan 2018.

In our age of automation, this makes sense. Wykoff's schematics mirror the timeless archetypal goal of his 'Composite Operator': max pain for all other market participants.
A process that lends itself to automation, optimized a bit more each passing year.
Peak cycle volatility maps directly to the Wykoff Distribution Schematic's 'Buying Climax'.
An event that preceded parabolic cycle tops, by about 2 weeks.
Future BTC parabolas (should they recur) would come at exponentially higher market caps, so they may take longer to unfold -- I don't take the 2 week pattern too seriously.
But Parabolic Distribution as an emergent archetypal market structure is likely encoded.

PUTTING IT ALL TOGETHER
Bitcoin Value Capture Heatmap signals peak cycle volatility, on a daily close of 4.2 on the metric's Y axis. It has never reached that level twice in the same cycle.
Awareness that:
(a) peak volatility for the cycle has likely been reached, and
(b) peak volatility has a history of tightly preceding bitcoin cycle tops, can
(c) empowers traders with a data-driven 'guide post' to their likely exactly location in an increasingly archetypal topping process.
SPECIFIC USES IN AN EXIT STRATEGY
When the Heatmap's signal level is reached, one might (for instance):
* Hedge, since bitcoin is likely closing in on its cycle top, OR
* Start to DCA out, over a pre-planned time period OR
* Rotate up the risk curve, since BTC probably doesn't have much upside left, OR
* Wait for acceptance one leg higher, which (consistent with Wykoff logic) is the likeliest place to expect an actual cycle top.
Though the ratio (in the past) touched 4.2 each cycle, a closer look shows subtly lower peaks per cycle, like most other on-chain cycle oscillators.
Extrapolating out, one might expect bitcoin's next top on volatility to print on any touch of 4.0 or higher.
Or one might give it more room to run, consistent with record institutiional flows this cycle.
Alerts are enabled for both options.

The metric works on any timeframe, but should only be used on the 1D chart.
"How much pressure on Bitcoin's market cap does one dollar of purchasing power exert?"
The higher the print, the more market cap grows per dollar invested -- adjusted for global M2 growth.
Bitcoin Value Capture Heatmap = ( market cap / global M2 ) / realized cap
A NOVEL INGREDIENT REVEALS A UNIQUE USE CASE
Adjusting bitcoin's market cap for global M2 growth sharpens a legacy metric with a normalizing factor that 'stabilizes' its view across cycles.
The metric peaked at identical levels (4.2), three bitcoin bull markets in a row. On the same day bitcoin price volatility peaked for the cycle, every time.
One might naturally expect this to coincide with cycle tops. But it doesn't.
It precede's cycle's tops: in a consistent, very specific way, that predisposing a unique use case.
BITCOIN'S VOLATILTY TOP
The metric's true use case only comes into clear focus when paired with an unrelated insight:
Whether in distribution (in Spring 2021) or a parabolic blow off top (2017 & 2013), each of the last 3 bitcoin cycle tops shows tight consistent adherence to the Wykoff Distribution Schematic.
"But Wykoff schematics apply to distribution tops, not to blow off tops."
A closer look at the last 15-20 years of parabolic blow off tops, across all asset classes, viewed through a Wykoff lens, reveals recurring tight adherence to Wykoff's Distribution Schematic.
Including (and especially) BTC's parabolic top in Dec 2017; BTC's parabolic top in 2013; and ETH's blow off top in Jan 2018.
In our age of automation, this makes sense. Wykoff's schematics mirror the timeless archetypal goal of his 'Composite Operator': max pain for all other market participants.
A process that lends itself to automation, optimized a bit more each passing year.
Peak cycle volatility maps directly to the Wykoff Distribution Schematic's 'Buying Climax'.
An event that preceded parabolic cycle tops, by about 2 weeks.
Future BTC parabolas (should they recur) would come at exponentially higher market caps, so they may take longer to unfold -- I don't take the 2 week pattern too seriously.
But Parabolic Distribution as an emergent archetypal market structure is likely encoded.
PUTTING IT ALL TOGETHER
Bitcoin Value Capture Heatmap signals peak cycle volatility, on a daily close of 4.2 on the metric's Y axis. It has never reached that level twice in the same cycle.
Awareness that:
(a) peak volatility for the cycle has likely been reached, and
(b) peak volatility has a history of tightly preceding bitcoin cycle tops, can
(c) empowers traders with a data-driven 'guide post' to their likely exactly location in an increasingly archetypal topping process.
SPECIFIC USES IN AN EXIT STRATEGY
When the Heatmap's signal level is reached, one might (for instance):
* Hedge, since bitcoin is likely closing in on its cycle top, OR
* Start to DCA out, over a pre-planned time period OR
* Rotate up the risk curve, since BTC probably doesn't have much upside left, OR
* Wait for acceptance one leg higher, which (consistent with Wykoff logic) is the likeliest place to expect an actual cycle top.
Though the ratio (in the past) touched 4.2 each cycle, a closer look shows subtly lower peaks per cycle, like most other on-chain cycle oscillators.
Extrapolating out, one might expect bitcoin's next top on volatility to print on any touch of 4.0 or higher.
Or one might give it more room to run, consistent with record institutiional flows this cycle.
Alerts are enabled for both options.
The metric works on any timeframe, but should only be used on the 1D chart.
릴리즈 노트
Minor settings update. Script output unaffected.릴리즈 노트
Minor code update, to remove the need for product keys. 초대 전용 스크립트
이 스크립트는 작성자가 승인한 사용자만 접근할 수 있습니다. 사용하려면 요청 후 승인을 받아야 하며, 일반적으로 결제 후에 허가가 부여됩니다. 자세한 내용은 아래 작성자의 안내를 따르거나 AlchemicalIntel에게 직접 문의하세요.
트레이딩뷰는 스크립트의 작동 방식을 충분히 이해하고 작성자를 완전히 신뢰하지 않는 이상, 해당 스크립트에 비용을 지불하거나 사용하는 것을 권장하지 않습니다. 커뮤니티 스크립트에서 무료 오픈소스 대안을 찾아보실 수도 있습니다.
작성자 지시 사항
Access to this script comes included with the Bull Market Top Playbook at https://www.alchemicalintel.com
면책사항
해당 정보와 게시물은 금융, 투자, 트레이딩 또는 기타 유형의 조언이나 권장 사항으로 간주되지 않으며, 트레이딩뷰에서 제공하거나 보증하는 것이 아닙니다. 자세한 내용은 이용 약관을 참조하세요.
초대 전용 스크립트
이 스크립트는 작성자가 승인한 사용자만 접근할 수 있습니다. 사용하려면 요청 후 승인을 받아야 하며, 일반적으로 결제 후에 허가가 부여됩니다. 자세한 내용은 아래 작성자의 안내를 따르거나 AlchemicalIntel에게 직접 문의하세요.
트레이딩뷰는 스크립트의 작동 방식을 충분히 이해하고 작성자를 완전히 신뢰하지 않는 이상, 해당 스크립트에 비용을 지불하거나 사용하는 것을 권장하지 않습니다. 커뮤니티 스크립트에서 무료 오픈소스 대안을 찾아보실 수도 있습니다.
작성자 지시 사항
Access to this script comes included with the Bull Market Top Playbook at https://www.alchemicalintel.com
면책사항
해당 정보와 게시물은 금융, 투자, 트레이딩 또는 기타 유형의 조언이나 권장 사항으로 간주되지 않으며, 트레이딩뷰에서 제공하거나 보증하는 것이 아닙니다. 자세한 내용은 이용 약관을 참조하세요.