OPEN-SOURCE SCRIPT
업데이트됨 Bitcoin Cycle Log-Curve (JDK-Analysis)
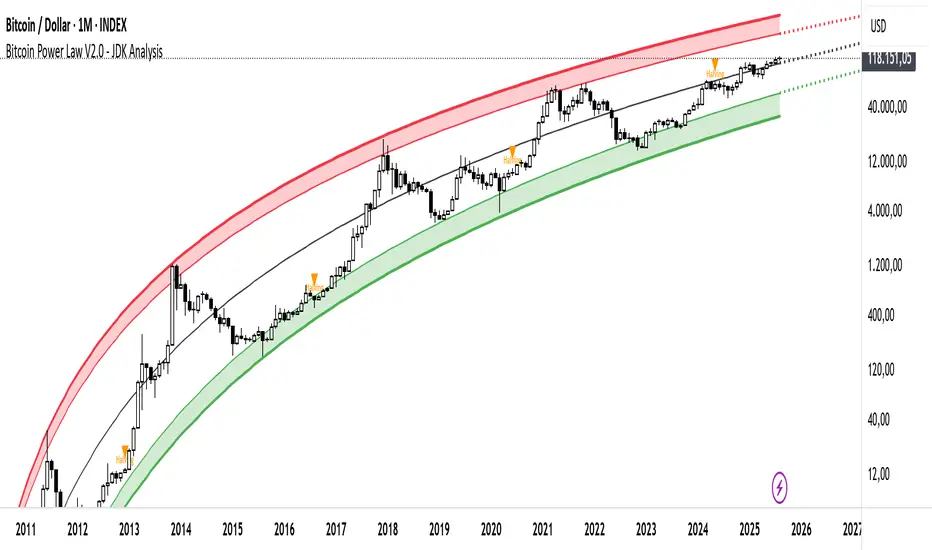
Important: The standard parameters provided in the script are specifically tuned for the TradingView Bitcoin Index chart on a monthly timeframe on logarithmic scale, and will yield the most accurate visual alignment when applied to that dataset. (more below)
This very simple script visualizes Bitcoin’s long-term price behavior using a logarithmic regression model designed to reflect the cyclical nature of Bitcoin’s historical market trends. Unlike typical technical indicators that react to recent price movements, this tool is built on the assumption that Bitcoin follows an exponential growth path over time, shaped by its fixed supply structure and four-year halving cycles.
The calculation behind the curved bands:
An upper boundary, a lower boundary, and a central midline, are calculated based on logarithmic functions applied to the bar index (which serves as a proxy for time). The upper and lower bounds are defined using exponential formulas of the type y = exp(constant + coefficient * log(bar_index)), allowing the curves to evolve dynamically over time. These bands serve as a macro-level guide for identifying periods of historical overvaluation (upper red curve) and undervaluation (lower green curve), with a central black curve representing the geometric average of the two.
How to customize the parameters:
How to use this indicator:
This indicator is not intended for short-term trading or intraday signals. Rather, it serves as a contextual framework for long-term investors to identify high-risk zones near the upper curve and potential long-term value opportunities near the lower curve. These areas historically align with cycle tops and bottoms, and the model helps to place current price action within that broader cyclical narrative. While the concept draws inspiration from Bitcoin’s halving-driven market cycles and exponential adoption curve, the implementation is original in its use of time-based logarithmic regression to define dynamic trend boundaries.
It is best used as a strategic tool for cycle analysis, macro positioning, and trend anchoring—rather than as a short-term signal provider.
This very simple script visualizes Bitcoin’s long-term price behavior using a logarithmic regression model designed to reflect the cyclical nature of Bitcoin’s historical market trends. Unlike typical technical indicators that react to recent price movements, this tool is built on the assumption that Bitcoin follows an exponential growth path over time, shaped by its fixed supply structure and four-year halving cycles.
The calculation behind the curved bands:
An upper boundary, a lower boundary, and a central midline, are calculated based on logarithmic functions applied to the bar index (which serves as a proxy for time). The upper and lower bounds are defined using exponential formulas of the type y = exp(constant + coefficient * log(bar_index)), allowing the curves to evolve dynamically over time. These bands serve as a macro-level guide for identifying periods of historical overvaluation (upper red curve) and undervaluation (lower green curve), with a central black curve representing the geometric average of the two.
How to customize the parameters:
- The lower1_const and upper1_const values vertically shift the respective lower and upper curves—more negative values push the curve downward, while higher values lift it.
- The lower1_coef and upper1_coef control the steepness of the curves over time, with higher values resulting in faster growth relative to time.
- The shift_factor allows for uniform vertical adjustment of all curves simultaneously.
- Additionally, the channel_width setting determines how far the mirrored bands extend from the original curves, creating a visual “channel” that can highlight more conservative or aggressive valuation zones depending on preference.
How to use this indicator:
This indicator is not intended for short-term trading or intraday signals. Rather, it serves as a contextual framework for long-term investors to identify high-risk zones near the upper curve and potential long-term value opportunities near the lower curve. These areas historically align with cycle tops and bottoms, and the model helps to place current price action within that broader cyclical narrative. While the concept draws inspiration from Bitcoin’s halving-driven market cycles and exponential adoption curve, the implementation is original in its use of time-based logarithmic regression to define dynamic trend boundaries.
It is best used as a strategic tool for cycle analysis, macro positioning, and trend anchoring—rather than as a short-term signal provider.
릴리즈 노트
Updated Version 2.0- Timeframe-agnostic: curves stay locked when you switch TFs
- Curved future projection (configurable horizon)
- Built-in Bitcoin halving markers
오픈 소스 스크립트
트레이딩뷰의 진정한 정신에 따라, 이 스크립트의 작성자는 이를 오픈소스로 공개하여 트레이더들이 기능을 검토하고 검증할 수 있도록 했습니다. 작성자에게 찬사를 보냅니다! 이 코드는 무료로 사용할 수 있지만, 코드를 재게시하는 경우 하우스 룰이 적용된다는 점을 기억하세요.
면책사항
해당 정보와 게시물은 금융, 투자, 트레이딩 또는 기타 유형의 조언이나 권장 사항으로 간주되지 않으며, 트레이딩뷰에서 제공하거나 보증하는 것이 아닙니다. 자세한 내용은 이용 약관을 참조하세요.
오픈 소스 스크립트
트레이딩뷰의 진정한 정신에 따라, 이 스크립트의 작성자는 이를 오픈소스로 공개하여 트레이더들이 기능을 검토하고 검증할 수 있도록 했습니다. 작성자에게 찬사를 보냅니다! 이 코드는 무료로 사용할 수 있지만, 코드를 재게시하는 경우 하우스 룰이 적용된다는 점을 기억하세요.
면책사항
해당 정보와 게시물은 금융, 투자, 트레이딩 또는 기타 유형의 조언이나 권장 사항으로 간주되지 않으며, 트레이딩뷰에서 제공하거나 보증하는 것이 아닙니다. 자세한 내용은 이용 약관을 참조하세요.