OPEN-SOURCE SCRIPT
Pressure - Buying and Selling
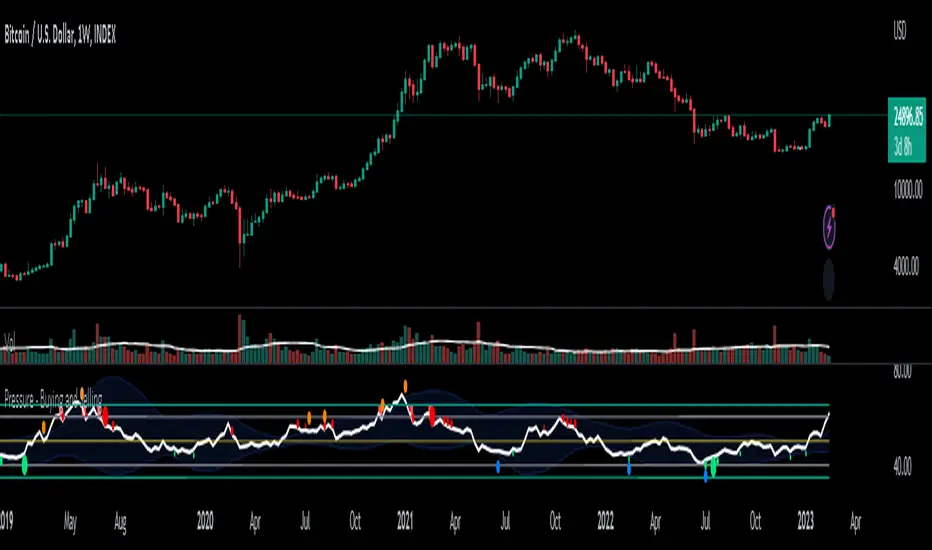
This is the Pressure Indicator.
The Pressure Indicator analyzes a number of price ratios to measure the pressure of Buyers and Sellers.
I’ve also added to the indicator:
1) Moving Averages (MA) – You can choose 3 types of MA:
- Simple Moving Average (SMA)
- Exponential Moving Average (EMA) - default
- Volume Weighted Moving Average (VWMA)
- Arnaud Legoux Moving Average (ALMA)
By default the MA are not displayed. You can turn them on or off.
2) Standard Deviation Bands and MA Bands – Bands only for the MA type 1 selection. Usually, the Pressureis inside the Bands. If it is beyond the Bands that could mean the current trend is ending. The MA Bands are turned off by default but you can turn them on the Styles Tab Menu.
3) Levels for Overbought and Oversold Zones:
- Gray Overbought 60
- Gray Oversold 40
4) Levels for Buying and Selling Pressure (3 types of pressure + 1 more). If the Pressure is crossing various intermediate levels that means there is Buying or Selling Pressure at those levels.
5) Signals for Crossing Overbought and Oversold Levels:
- Top Red fills for Crossing Down Overbought Level
- Bottom Lime fills for Crossing Up Oversold Level
6) Signals for Buying and Selling Pressure:
- Buy Pressure 1 and 2 are the smaller lime dots.
- Buy Pressure 1 and 2 together are the bigger lime dots.
- Buy Pressure 3 (Crossing Deviation Bands Up) are the blue dots.
- Sell Pressure 1 and 2 are the smaller red dots.
- Sell Pressure 1 and 2 together are the bigger red dots.
- Sell Pressure 3 (Crossing Deviation Bands Down) are the orange dots.
If there are more than one dot appearing at the same moment they will appear displaced in a vertical way at the same time.
If there is something wrong with the code or its calculations, please let me know.
If you want to modify or improve the code, feel free to do that, but please let me know the changes you made.
This Indicator is very accurate when using the Weekly Timeframe . I hope you enjoy it!
오픈 소스 스크립트
트레이딩뷰의 진정한 정신에 따라, 이 스크립트의 작성자는 이를 오픈소스로 공개하여 트레이더들이 기능을 검토하고 검증할 수 있도록 했습니다. 작성자에게 찬사를 보냅니다! 이 코드는 무료로 사용할 수 있지만, 코드를 재게시하는 경우 하우스 룰이 적용된다는 점을 기억하세요.
면책사항
해당 정보와 게시물은 금융, 투자, 트레이딩 또는 기타 유형의 조언이나 권장 사항으로 간주되지 않으며, 트레이딩뷰에서 제공하거나 보증하는 것이 아닙니다. 자세한 내용은 이용 약관을 참조하세요.
오픈 소스 스크립트
트레이딩뷰의 진정한 정신에 따라, 이 스크립트의 작성자는 이를 오픈소스로 공개하여 트레이더들이 기능을 검토하고 검증할 수 있도록 했습니다. 작성자에게 찬사를 보냅니다! 이 코드는 무료로 사용할 수 있지만, 코드를 재게시하는 경우 하우스 룰이 적용된다는 점을 기억하세요.
면책사항
해당 정보와 게시물은 금융, 투자, 트레이딩 또는 기타 유형의 조언이나 권장 사항으로 간주되지 않으며, 트레이딩뷰에서 제공하거나 보증하는 것이 아닙니다. 자세한 내용은 이용 약관을 참조하세요.