INVITE-ONLY SCRIPT
Wizard Dynamic EMA Table
Purpose of the Script
Track Multiple EMAs:
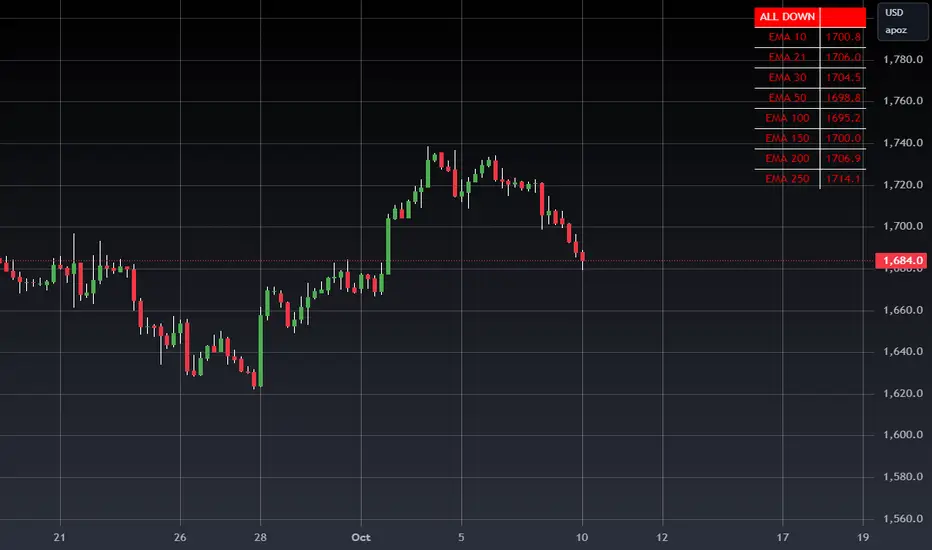
Displays 8 EMAs with their respective values.
Indicates whether each EMA is trending upward (green) or downward (red).
Summary Indicator:
A top cell provides a quick, overall trend:
Green ("ALL UP"): All EMAs are trending upward.
Red ("ALL DOWN"): All EMAs are trending downward.
Gray ("MIXED"): Some EMAs are up, and some are down.
Customizable:
The user can configure EMA periods to match their trading strategy.
Click Add to Chart (top-right corner of the Pine Editor).
The dashboard will appear on your chart.
How to Use the Dashboard
Monitor EMAs:
Look at the EMA table for real-time updates on each EMA's value and trend (up or down).
Quick Market Trend Analysis:
Check the summary cell at the top:
ALL UP (Green): Strong upward trend across all monitored EMAs.
ALL DOWN (Red): Strong downward trend across all monitored EMAs.
MIXED (Gray): Market is indecisive or ranging.
Customize EMA Periods:
Adjust the EMA periods from the script's settings:
Click the gear icon on the indicator in the chart legend.
Modify the EMA periods to match your trading strategy (e.g., 21, 50, 100, etc.).
Apply to Any Asset:
Use this script for any asset (stocks, forex, crypto, futures) available on TradingView.
Trading Strategies with the Dashboard
Trend-Following Strategy:
If the summary cell shows ALL UP, consider looking for long opportunities.
If the summary cell shows ALL DOWN, consider looking for short opportunities.
Reversal Strategy:
When the summary changes from ALL UP to MIXED or ALL DOWN, it might signal a weakening uptrend or potential reversal.
Confluence with Other Indicators:
Apply the dashboard to any timeframe (e.g., 1-minute, 1-hour, daily) depending on your trading style.
Benefits of Using This Script
Saves Time:
Quickly analyze trends across multiple EMAs without manually calculating or interpreting each one.
Visual Clarity:
The color-coded table provides instant insights into market conditions.
Customizable:
Tailor the EMA periods and apply it to any asset or timeframe.
"Disclaimer: This indicator is intended for educational purposes only and does not constitute financial advice. Trading involves significant risk, and users should perform their own research and consult with a licensed financial advisor before making any trading decisions."
Track Multiple EMAs:
Displays 8 EMAs with their respective values.
Indicates whether each EMA is trending upward (green) or downward (red).
Summary Indicator:
A top cell provides a quick, overall trend:
Green ("ALL UP"): All EMAs are trending upward.
Red ("ALL DOWN"): All EMAs are trending downward.
Gray ("MIXED"): Some EMAs are up, and some are down.
Customizable:
The user can configure EMA periods to match their trading strategy.
Click Add to Chart (top-right corner of the Pine Editor).
The dashboard will appear on your chart.
How to Use the Dashboard
Monitor EMAs:
Look at the EMA table for real-time updates on each EMA's value and trend (up or down).
Quick Market Trend Analysis:
Check the summary cell at the top:
ALL UP (Green): Strong upward trend across all monitored EMAs.
ALL DOWN (Red): Strong downward trend across all monitored EMAs.
MIXED (Gray): Market is indecisive or ranging.
Customize EMA Periods:
Adjust the EMA periods from the script's settings:
Click the gear icon on the indicator in the chart legend.
Modify the EMA periods to match your trading strategy (e.g., 21, 50, 100, etc.).
Apply to Any Asset:
Use this script for any asset (stocks, forex, crypto, futures) available on TradingView.
Trading Strategies with the Dashboard
Trend-Following Strategy:
If the summary cell shows ALL UP, consider looking for long opportunities.
If the summary cell shows ALL DOWN, consider looking for short opportunities.
Reversal Strategy:
When the summary changes from ALL UP to MIXED or ALL DOWN, it might signal a weakening uptrend or potential reversal.
Confluence with Other Indicators:
Apply the dashboard to any timeframe (e.g., 1-minute, 1-hour, daily) depending on your trading style.
Benefits of Using This Script
Saves Time:
Quickly analyze trends across multiple EMAs without manually calculating or interpreting each one.
Visual Clarity:
The color-coded table provides instant insights into market conditions.
Customizable:
Tailor the EMA periods and apply it to any asset or timeframe.
"Disclaimer: This indicator is intended for educational purposes only and does not constitute financial advice. Trading involves significant risk, and users should perform their own research and consult with a licensed financial advisor before making any trading decisions."
초대 전용 스크립트
이 스크립트는 작성자가 승인한 사용자만 접근할 수 있습니다. 사용하려면 요청 후 승인을 받아야 하며, 일반적으로 결제 후에 허가가 부여됩니다. 자세한 내용은 아래 작성자의 안내를 따르거나 WIZARDTRENDS에게 직접 문의하세요.
이 비공개 초대 전용 스크립트는 스크립트 모더레이터의 검토를 거치지 않았으며, 하우스 룰 준수 여부는 확인되지 않았습니다. 트레이딩뷰는 스크립트의 작동 방식을 충분히 이해하고 작성자를 완전히 신뢰하지 않는 이상, 해당 스크립트에 비용을 지불하거나 사용하는 것을 권장하지 않습니다. 커뮤니티 스크립트에서 무료 오픈소스 대안을 찾아보실 수도 있습니다.
작성자 지시 사항
FEEL FREE TO REACH US
면책사항
해당 정보와 게시물은 금융, 투자, 트레이딩 또는 기타 유형의 조언이나 권장 사항으로 간주되지 않으며, 트레이딩뷰에서 제공하거나 보증하는 것이 아닙니다. 자세한 내용은 이용 약관을 참조하세요.