OPEN-SOURCE SCRIPT
업데이트됨 Average Candle Range [UkutaLabs]
█ OVERVIEW
The Average Candle Range is a powerful indicator that compares the size of the current bar to past bars. This comparison can be used in a wide variety of trading strategies, allowing traders to understand at a glance the relative size of each candle.
█ USAGE
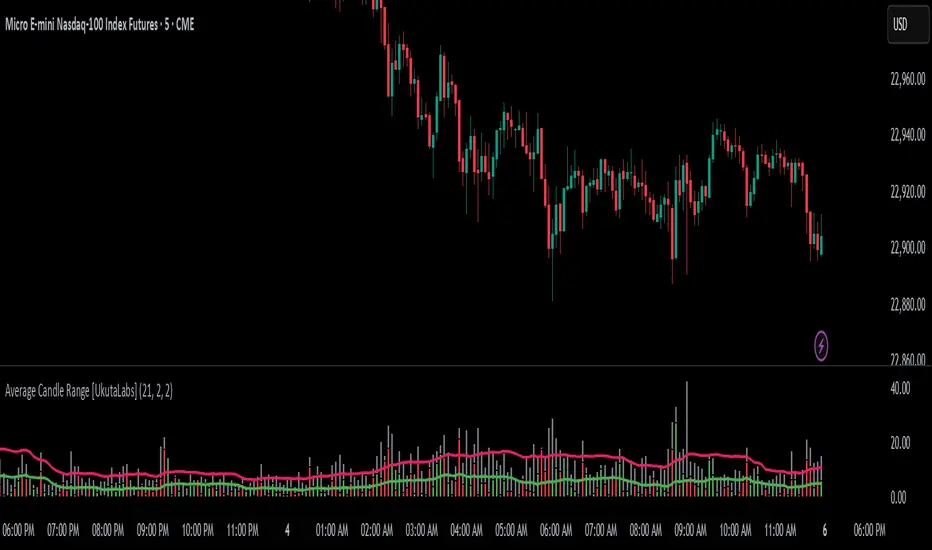
As each candlestick forms, two bars will be plotted on the indicator. The grey bar represents the total range of the candle from the high to the low, and the second bar represents the body of the bar from the open to the close. Depending on whether the bar is bullish or bearish, the second bar will be colored green or red respectively.
Two averages will also be drawn over these bars that represent the average size of the two bar types over a period that is specified by the user. These averages can be toggled in the indicator settings.
█ SETTINGS
Configuration
• Period: Determines how many bars to use in the calculation of the averages.
• Show Bar Average: Determines whether or not the average for the full bar size is displayed.
• Show Body Average: Determines whether or not the average for the body is displayed.
The Average Candle Range is a powerful indicator that compares the size of the current bar to past bars. This comparison can be used in a wide variety of trading strategies, allowing traders to understand at a glance the relative size of each candle.
█ USAGE
As each candlestick forms, two bars will be plotted on the indicator. The grey bar represents the total range of the candle from the high to the low, and the second bar represents the body of the bar from the open to the close. Depending on whether the bar is bullish or bearish, the second bar will be colored green or red respectively.
Two averages will also be drawn over these bars that represent the average size of the two bar types over a period that is specified by the user. These averages can be toggled in the indicator settings.
█ SETTINGS
Configuration
• Period: Determines how many bars to use in the calculation of the averages.
• Show Bar Average: Determines whether or not the average for the full bar size is displayed.
• Show Body Average: Determines whether or not the average for the body is displayed.
릴리즈 노트
Added ability to customize the 'Averages' lines - color and size.오픈 소스 스크립트
트레이딩뷰의 진정한 정신에 따라, 이 스크립트의 작성자는 이를 오픈소스로 공개하여 트레이더들이 기능을 검토하고 검증할 수 있도록 했습니다. 작성자에게 찬사를 보냅니다! 이 코드는 무료로 사용할 수 있지만, 코드를 재게시하는 경우 하우스 룰이 적용된다는 점을 기억하세요.
면책사항
해당 정보와 게시물은 금융, 투자, 트레이딩 또는 기타 유형의 조언이나 권장 사항으로 간주되지 않으며, 트레이딩뷰에서 제공하거나 보증하는 것이 아닙니다. 자세한 내용은 이용 약관을 참조하세요.
오픈 소스 스크립트
트레이딩뷰의 진정한 정신에 따라, 이 스크립트의 작성자는 이를 오픈소스로 공개하여 트레이더들이 기능을 검토하고 검증할 수 있도록 했습니다. 작성자에게 찬사를 보냅니다! 이 코드는 무료로 사용할 수 있지만, 코드를 재게시하는 경우 하우스 룰이 적용된다는 점을 기억하세요.
면책사항
해당 정보와 게시물은 금융, 투자, 트레이딩 또는 기타 유형의 조언이나 권장 사항으로 간주되지 않으며, 트레이딩뷰에서 제공하거나 보증하는 것이 아닙니다. 자세한 내용은 이용 약관을 참조하세요.