OPEN-SOURCE SCRIPT
Price-EMA Z-Score Background
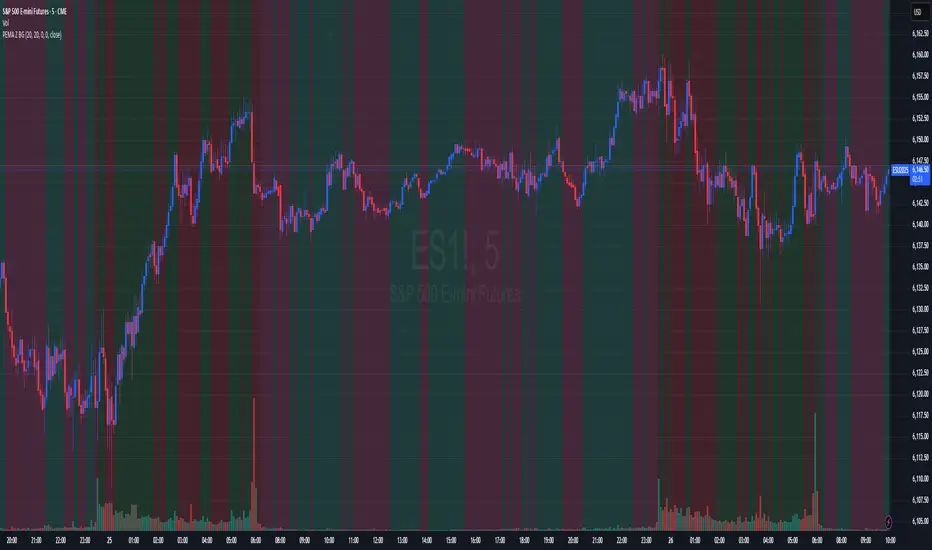
he “Price‑to‑EMA Z‑Score Background” indicator is designed to give you a clear, visual sense of when price has moved unusually far away from its smoothed trend, and to highlight those moments as potential overextension or mean‑reversion opportunities. Under the hood, it first computes a standard exponential moving average (EMA) of your chosen lookback length, then measures the raw difference between the current close and that EMA on every bar. To make that raw deviation comparable across different markets and timeframes, it converts the series of differences into a z‑score—subtracting the rolling mean of the deviations and dividing by their rolling standard deviation over a second lookback window.
Once you’ve normalized price‑to‑EMA distance into z‑score units, you can set two simple trigger levels: one upper threshold and one lower threshold. Whenever the z‑score climbs above the upper threshold, the chart background glows green, signaling that price is extended far above its EMA (and might be ripe for a pullback). Whenever the z‑score falls below the lower threshold, the background turns red, calling out an equally extreme move below the EMA (and a possible oversold bounce). Between those bands, no shading appears, letting you know price is trading within its “normal” range around the trend.
By adjusting the EMA period, the z‑score lookback, and the two trigger levels, you can dial in early warning signals (e.g. ±1 σ) or wait for very stretched moves (±2 σ or more). Used in concert with your favorite momentum or pattern tools—or even as a standalone visual cue—this simple background‑shading approach makes it easy to spot when a market is running too hot or too cold relative to its own recent average.
오픈 소스 스크립트
트레이딩뷰의 진정한 정신에 따라, 이 스크립트의 작성자는 이를 오픈소스로 공개하여 트레이더들이 기능을 검토하고 검증할 수 있도록 했습니다. 작성자에게 찬사를 보냅니다! 이 코드는 무료로 사용할 수 있지만, 코드를 재게시하는 경우 하우스 룰이 적용된다는 점을 기억하세요.
면책사항
해당 정보와 게시물은 금융, 투자, 트레이딩 또는 기타 유형의 조언이나 권장 사항으로 간주되지 않으며, 트레이딩뷰에서 제공하거나 보증하는 것이 아닙니다. 자세한 내용은 이용 약관을 참조하세요.
오픈 소스 스크립트
트레이딩뷰의 진정한 정신에 따라, 이 스크립트의 작성자는 이를 오픈소스로 공개하여 트레이더들이 기능을 검토하고 검증할 수 있도록 했습니다. 작성자에게 찬사를 보냅니다! 이 코드는 무료로 사용할 수 있지만, 코드를 재게시하는 경우 하우스 룰이 적용된다는 점을 기억하세요.
면책사항
해당 정보와 게시물은 금융, 투자, 트레이딩 또는 기타 유형의 조언이나 권장 사항으로 간주되지 않으며, 트레이딩뷰에서 제공하거나 보증하는 것이 아닙니다. 자세한 내용은 이용 약관을 참조하세요.