OPEN-SOURCE SCRIPT
3-Criteria Strategy
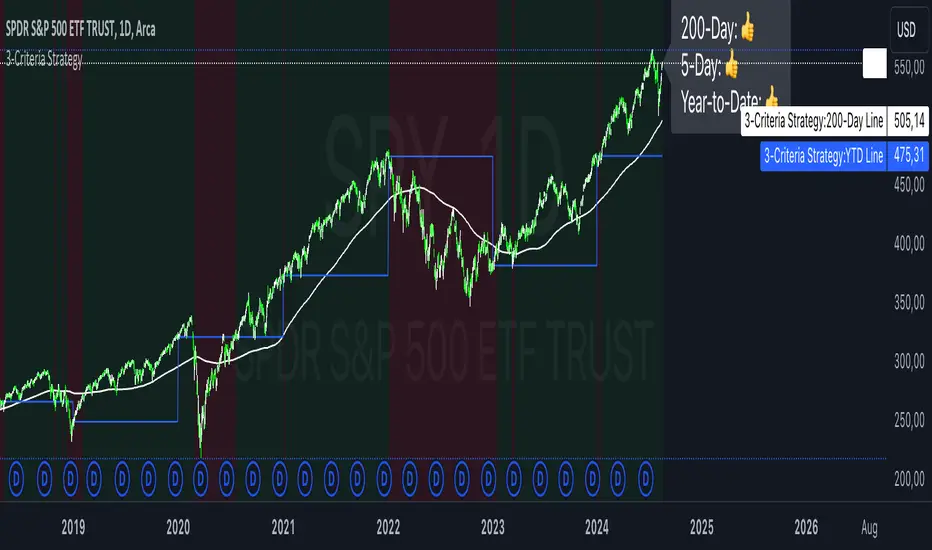
The "3-Criteria Strategy" is a simple yet effective trading strategy based on three criteria:
200-Day Moving Average: The first criterion checks whether the current price is above or below the 200-day moving average (SMA). A price above the 200-day line is considered bullish (thumbs up), while a price below is considered bearish (thumbs down).
5-Day Indicator: The second criterion evaluates the performance of the first five trading days of the year. If the closing price on the fifth trading day is higher than the closing price on the last trading day of the previous year, this is considered bullish (thumbs up). Otherwise, it's bearish (thumbs down).
Year-to-Date (YTD) Effect: The third criterion compares the current price with the closing price at the end of the previous year. A current price above the year-end price is bullish (thumbs up), while a price below is bearish (thumbs down).
Signal Interpretation:
Buy Signal: At least two of the three criteria must give a bullish signal (thumbs up).
Sell Signal: Zero or one bullish signal results in a bearish outlook.
The script provides visual cues with background colors:
Green background: Indicates a buy signal.
Red background: Indicates a sell signal.
Additionally, the script plots the 200-day moving average and the YTD line on the chart for better visualization.
Usage:
Apply the Script: Add the script to your TradingView chart.
Interpret Signals: Monitor the background color and the status label to determine trading actions.
Visual Aids: Use the 200-day line and YTD line plotted on the chart to confirm the criteria visually.
Scientific Research
The concepts used in this script—like the 200-day moving average and Year-to-Date effects—are well-documented in financial literature. However, the combination of these specific criteria as a trading strategy is more of a heuristic approach commonly used by traders rather than a subject of extensive academic research.
200-Day Moving Average: The 200-day moving average is widely regarded as a significant level in technical analysis, often serving as a demarcation between long-term bullish and bearish trends. Research has shown that long-term moving averages can be useful for trend-following strategies.
Reference: Brock, W., Lakonishok, J., & LeBaron, B. (1992). Simple Technical Trading Rules and the Stochastic Properties of Stock Returns. Journal of Finance, 47(5), 1731-1764.
Year-to-Date and Calendar Effects: The Year-to-Date effect and early-year performance (such as the January effect) have been studied extensively in the context of seasonal market anomalies.
Reference: Rozeff, M. S., & Kinney, W. R. (1976). Capital Market Seasonality: The Case of Stock Returns. Journal of Financial Economics, 3(4), 379-402.
While these papers don't address the exact combination of criteria used in your strategy, they provide a solid foundation for understanding the underlying concepts.
오픈 소스 스크립트
트레이딩뷰의 진정한 정신에 따라, 이 스크립트의 작성자는 이를 오픈소스로 공개하여 트레이더들이 기능을 검토하고 검증할 수 있도록 했습니다. 작성자에게 찬사를 보냅니다! 이 코드는 무료로 사용할 수 있지만, 코드를 재게시하는 경우 하우스 룰이 적용된다는 점을 기억하세요.
Where others speculate, we systematize.
edgetools.org
edgetools.org
면책사항
해당 정보와 게시물은 금융, 투자, 트레이딩 또는 기타 유형의 조언이나 권장 사항으로 간주되지 않으며, 트레이딩뷰에서 제공하거나 보증하는 것이 아닙니다. 자세한 내용은 이용 약관을 참조하세요.