OPEN-SOURCE SCRIPT
업데이트됨 3 Weeks Tight - CANSLIM Technical Indicator
3 Weeks Tight - Introduction
3 weeks tight is a bullish continuation pattern discovered by IBD's founder, William O'Neil.
The pattern can used as an opportunity to add to an existing position as it often occurs after a breakout above a cup with handle or other technical pattern.
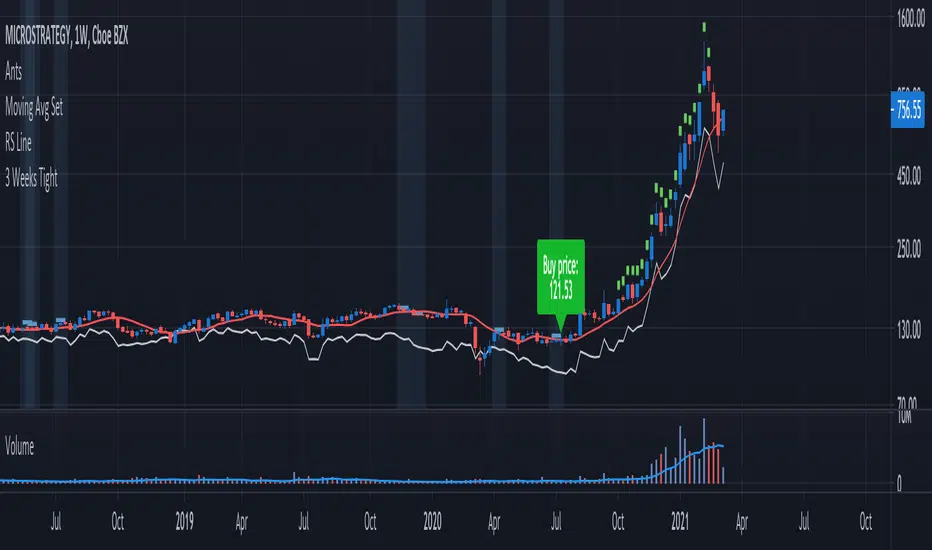
The 3 weeks tight pattern forms when a stock closes within approximately 1% to 1.5% of the prior week's close for at least two weeks. The reason for the bullishness is that it indciates that investors who moved the stock upward in price since the breakout are not taking profits, the price is holding steady.
The buy point is just above the area of resistance formed at the highs of the three weeks plus 10 cents. The ten cent addition to the price is to ensure a push through the resistance at the high of the range.

Key Points:
Features:
3 weeks tight is a bullish continuation pattern discovered by IBD's founder, William O'Neil.
The pattern can used as an opportunity to add to an existing position as it often occurs after a breakout above a cup with handle or other technical pattern.
The 3 weeks tight pattern forms when a stock closes within approximately 1% to 1.5% of the prior week's close for at least two weeks. The reason for the bullishness is that it indciates that investors who moved the stock upward in price since the breakout are not taking profits, the price is holding steady.
The buy point is just above the area of resistance formed at the highs of the three weeks plus 10 cents. The ten cent addition to the price is to ensure a push through the resistance at the high of the range.
Key Points:
- It's preferred that closes for each week are in the upper half of the stock's range.
- Ideally, volume will increase significantly as the stocks moves past the buy point.
- This pattern generally performs best when the market is in an uptrend.
Features:
- A configurable horizontal bar that spans the 3 week period.
- A vertical band that highlights the tightness pattern.
- A label to show the buy price after 3 week tight pattern.
- Optional alert when the 3 weeks tight pattern is recognized.
릴리즈 노트
version 2.0Updates:
■ The offset of the "Buy price" can be moved up/down.
■ The font size of the "Buy price" can be configured.
릴리즈 노트
version 3.0Updates:
■ Percent change calculations have been updated.
■ Settings dialog now groups together similar features.
오픈 소스 스크립트
진정한 트레이딩뷰 정신에 따라 이 스크립트 작성자는 트레이더가 기능을 검토하고 검증할 수 있도록 오픈소스로 공개했습니다. 작성자에게 찬사를 보냅니다! 무료로 사용할 수 있지만 코드를 다시 게시할 경우 하우스 룰이 적용된다는 점을 기억하세요.
Access our premium tools: LevelUpTools.net
Join traders in over 40 countries and LevelUp!
Join traders in over 40 countries and LevelUp!
면책사항
이 정보와 게시물은 TradingView에서 제공하거나 보증하는 금융, 투자, 거래 또는 기타 유형의 조언이나 권고 사항을 의미하거나 구성하지 않습니다. 자세한 내용은 이용 약관을 참고하세요.