PROTECTED SOURCE SCRIPT
Equities Open
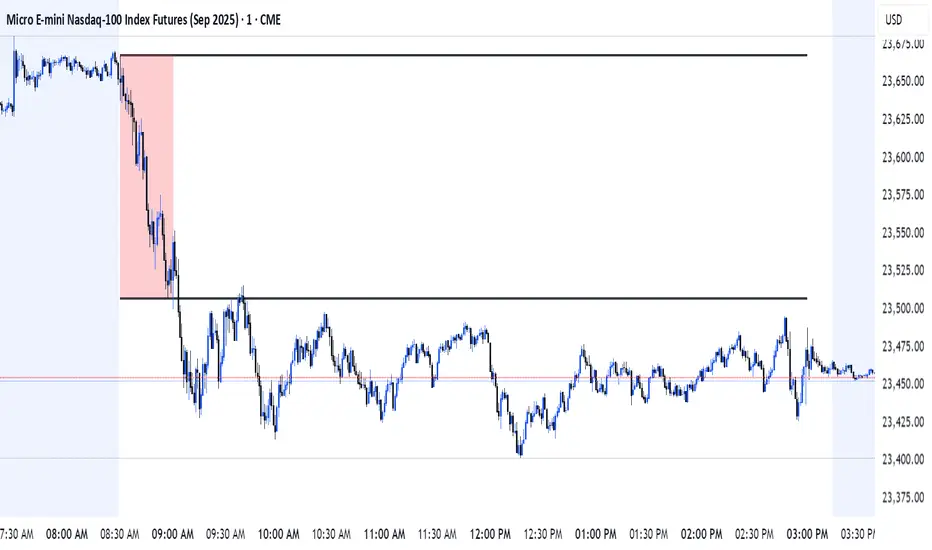
The Equities Open indicator makes it easy to spot the highest and lowest prices during the equities open or a customizable time you choose. It draws lines to show the high and low points and extends them across the chart to a time you pick, such as 3:00 PM that same day. A shaded box highlights the price range during that session. You can customize things such as the session time, timezone, line thickness, colors, and choose if you want the shaded box to show up. It’s built to run smoothly and works best for charts with short timeframes (up to 59 minutes). Perfect for traders who want to focus on key price levels set during pre-market hours!
보호된 스크립트입니다
이 스크립트는 비공개 소스로 게시됩니다. 하지만 제한 없이 자유롭게 사용할 수 있습니다 — 여기에서 자세히 알아보기.
면책사항
이 정보와 게시물은 TradingView에서 제공하거나 보증하는 금융, 투자, 거래 또는 기타 유형의 조언이나 권고 사항을 의미하거나 구성하지 않습니다. 자세한 내용은 이용 약관을 참고하세요.
보호된 스크립트입니다
이 스크립트는 비공개 소스로 게시됩니다. 하지만 제한 없이 자유롭게 사용할 수 있습니다 — 여기에서 자세히 알아보기.
면책사항
이 정보와 게시물은 TradingView에서 제공하거나 보증하는 금융, 투자, 거래 또는 기타 유형의 조언이나 권고 사항을 의미하거나 구성하지 않습니다. 자세한 내용은 이용 약관을 참고하세요.