OPEN-SOURCE SCRIPT
업데이트됨 BGL - Bitcoin Global Liquidity Indicator [Da_Prof]
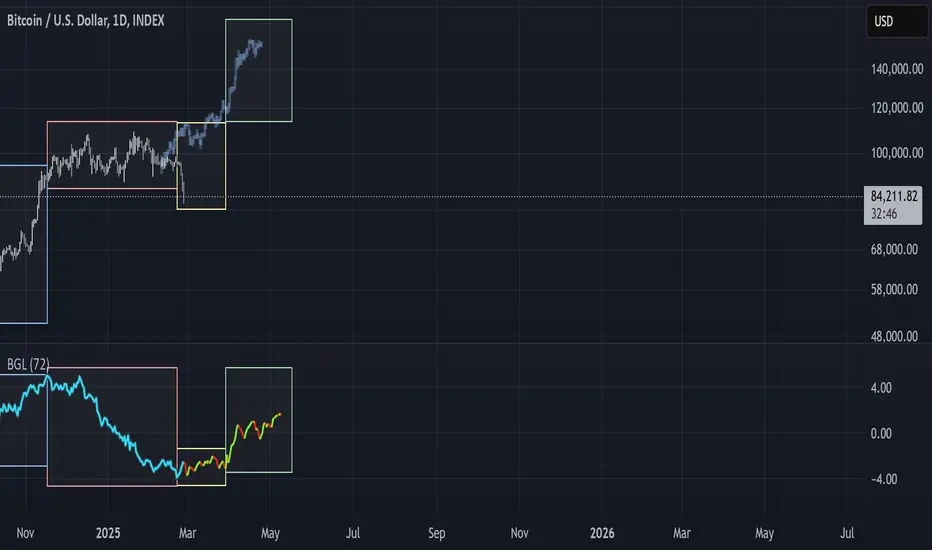
This indicator takes global liquidity and shifts it forward by a set number of days. It can be used for any asset, but it is by default set for Bitcoin (BTC). The shift forward allows potential future prediction of BTC trends, especially uptrends. While not perfect, the current shift of 72 days seems to be best for the current cycle.
Sixteen currencies are used to calculate global liquidity.
Sixteen currencies are used to calculate global liquidity.
릴리즈 노트
I was asked to add more of a description here. The script source code is viewable, so hopefully you can see exactly how the indicator is calculated. For the Global Money Supply (i.e., what is called "Global Liquidity" for the indicator), the money supply from multiple "major" countries is adjusted against its FX to USD pair and added together. There are limitations on TradingView, so currently the money supply is made up of US, CN, JP, EU, KR, IN, CA, AU, TW, BR, CH, RU, MX, TH, ID, and SG. All are added and the entire amount is divided by 1e12. Once the global money supply is found, we are interested in the change in money supply to see how liquidity is increasing or decreasing. The indicator is set to compare the current global money supply to the money supply a set number of days prior. This allows us to see how previous changes in money supply effect price movements in liquidity-sensitive assets. In testing, I found that liquidity calculated in this manner appears to front run the price of Bitcoin, likely since BTC is very sensitive to liquidity. The best period to predict
The BGL plots the change in liquidity N-number of days prior to today (default = 72 days). Since the BGL calculates the change in money supply from N-days ago, we can "plot the future". The change in liquidity can be plotted either N-number of days into the future or 500 data points (TV limitations), whichever is less. The future liquidity change is plotted as green for increasing liquidity and red for decreasing liquidity.
The original chart highlights significant increases in 72-day liquidity (dotted horizontal lines) starting from October 31, 2022 through November 18, 2024. Focus on the indicator and how each of these uptrends in liquidity are highlighted (i.e., between each dotted horizontal line is a significant uptrend in global money supply on the BGL). Now focus on the
릴리즈 노트
Corrected for an error in the JPY data. JPYM3 is only off by a factor of 10x for the month of October 2024. If Tradingview corrects this, I'll have to change the indicator back later. 릴리즈 노트
The JPY data set was corrected. The indicator was reset to the original. Also grey was added to the color scheme for timeframes lower than the daily.릴리즈 노트
Added the ability to pick the input money supply variables. This allows deselection of these variables that get corrupted. Multiple times, the input data for the money supply has been corrupted (e.g., currently THM3 is corrupted). Now you can deselect each money supply variable individually so that while that data is corrupted, you can still use the indicator.
Hope that is an acceptable workaround for y'all.
--Da_Prof
오픈 소스 스크립트
트레이딩뷰의 진정한 정신에 따라, 이 스크립트의 작성자는 이를 오픈소스로 공개하여 트레이더들이 기능을 검토하고 검증할 수 있도록 했습니다. 작성자에게 찬사를 보냅니다! 이 코드는 무료로 사용할 수 있지만, 코드를 재게시하는 경우 하우스 룰이 적용된다는 점을 기억하세요.
면책사항
해당 정보와 게시물은 금융, 투자, 트레이딩 또는 기타 유형의 조언이나 권장 사항으로 간주되지 않으며, 트레이딩뷰에서 제공하거나 보증하는 것이 아닙니다. 자세한 내용은 이용 약관을 참조하세요.
오픈 소스 스크립트
트레이딩뷰의 진정한 정신에 따라, 이 스크립트의 작성자는 이를 오픈소스로 공개하여 트레이더들이 기능을 검토하고 검증할 수 있도록 했습니다. 작성자에게 찬사를 보냅니다! 이 코드는 무료로 사용할 수 있지만, 코드를 재게시하는 경우 하우스 룰이 적용된다는 점을 기억하세요.
면책사항
해당 정보와 게시물은 금융, 투자, 트레이딩 또는 기타 유형의 조언이나 권장 사항으로 간주되지 않으며, 트레이딩뷰에서 제공하거나 보증하는 것이 아닙니다. 자세한 내용은 이용 약관을 참조하세요.