OPEN-SOURCE SCRIPT
업데이트됨 WaveTrend Oscillator [Krypt]

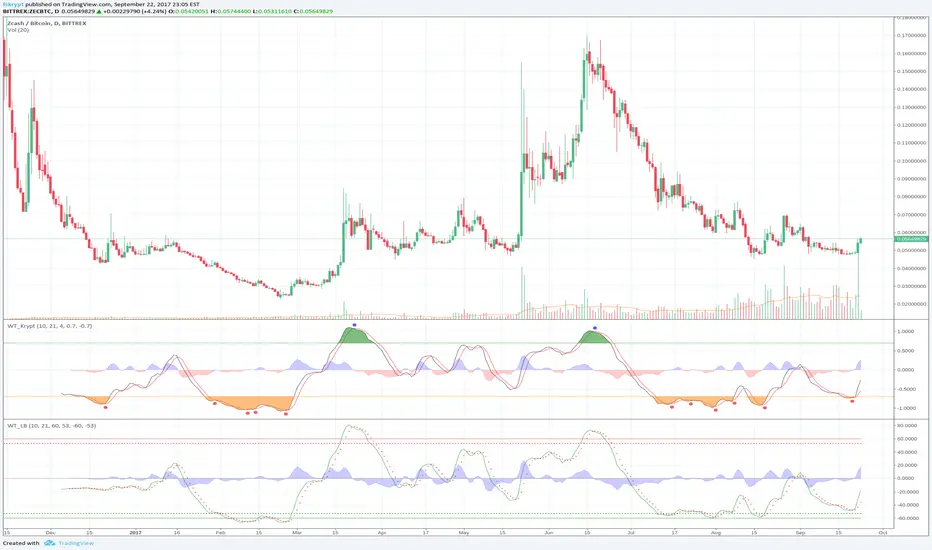
This is similar to regular WaveTrend Oscillator except:
- replaces hlc3 input with a weighted log formula for better stability/performance on high volatility charts
- zero-centered scaling
- SMA crossovers above and below OB/OS thresholds are marked as buy/sell signals
- replaces hlc3 input with a weighted log formula for better stability/performance on high volatility charts
- zero-centered scaling
- SMA crossovers above and below OB/OS thresholds are marked as buy/sell signals
릴리즈 노트
Use SMA curvature information to filter out buy/sell signals likely to be false positives릴리즈 노트
Rename some chart objects릴리즈 노트
Long/Short signal now captures some cases of bullish and bearish divergences릴리즈 노트
Use extra signal smoothing and extra momentum check for curvature릴리즈 노트
improve buy/sell signals릴리즈 노트
don't make helper elements editable릴리즈 노트
start drawing signal earlier, perform averaging on cross steps for more stable bullish/bearish divergence detection릴리즈 노트
use a 1+2 formula for curvature릴리즈 노트
Default to lower smoothing to still show something on the chart in the beginning릴리즈 노트
switch back to 4 for default SMA length릴리즈 노트
Improve sensitivity in the beginning of the chart릴리즈 노트
add comment릴리즈 노트
Replace final EMA smoother with Ehlers' smoother for higher sensitivity릴리즈 노트
Ignore first candle릴리즈 노트
reduce default smoothing slightly and allow zero smoothing릴리즈 노트
do not count MA cross above overbought level as bottom, and likewise do not count count MA cross below oversold level as top.릴리즈 노트
Simplify generation of buy/sell signals릴리즈 노트
fix how continues climb/descent is determined릴리즈 노트
detect hidden divergences릴리즈 노트
Update colors to make this indicator suitable for either light or dark T/V color modes릴리즈 노트
quantitatively weigh bullish and bearish signals오픈 소스 스크립트
트레이딩뷰의 진정한 정신에 따라, 이 스크립트의 작성자는 이를 오픈소스로 공개하여 트레이더들이 기능을 검토하고 검증할 수 있도록 했습니다. 작성자에게 찬사를 보냅니다! 이 코드는 무료로 사용할 수 있지만, 코드를 재게시하는 경우 하우스 룰이 적용된다는 점을 기억하세요.
면책사항
해당 정보와 게시물은 금융, 투자, 트레이딩 또는 기타 유형의 조언이나 권장 사항으로 간주되지 않으며, 트레이딩뷰에서 제공하거나 보증하는 것이 아닙니다. 자세한 내용은 이용 약관을 참조하세요.
오픈 소스 스크립트
트레이딩뷰의 진정한 정신에 따라, 이 스크립트의 작성자는 이를 오픈소스로 공개하여 트레이더들이 기능을 검토하고 검증할 수 있도록 했습니다. 작성자에게 찬사를 보냅니다! 이 코드는 무료로 사용할 수 있지만, 코드를 재게시하는 경우 하우스 룰이 적용된다는 점을 기억하세요.
면책사항
해당 정보와 게시물은 금융, 투자, 트레이딩 또는 기타 유형의 조언이나 권장 사항으로 간주되지 않으며, 트레이딩뷰에서 제공하거나 보증하는 것이 아닙니다. 자세한 내용은 이용 약관을 참조하세요.