OPEN-SOURCE SCRIPT
업데이트됨 MoneyLine Cipher
MoneyLine Cipher
Overview
MoneyLine Cipher is a trend-following indicator designed to identify high-probability entry and exit points by combining multiple technical analysis methods into a unified signal system. The indicator adapts its behavior based on current market conditions, becoming more aggressive in strong trends and more conservative in choppy or uncertain markets.
Core Concept: The Money Line
At the heart of this indicator is the Money Line, a linear regression line that acts as a dynamic center of price action. Unlike a simple moving average, linear regression fits a straight line through recent prices using least-squares methodology, providing a smoother representation of the underlying trend direction. The slope of this line determines whether the market is in a bullish, bearish, or neutral state.
Dynamic Envelope Bands
The indicator plots upper and lower bands around the Money Line using Average True Range (ATR) as the volatility measure. What makes these bands unique is their adaptive multiplier system. When the ADX (Average Directional Index) indicates a strong trend, the bands automatically widen to accommodate larger price swings and avoid premature exits. In ranging or weak trend conditions, the bands contract to provide tighter entry and exit zones. This dynamic adjustment helps the indicator perform consistently across different market environments.
Trend State Detection
The indicator classifies market conditions into five distinct states: Strong Uptrend, Uptrend, Neutral, Downtrend, and Strong Downtrend. This classification uses three complementary methods working together.
First, the Directional Movement Index (DMI) measures the spread between positive and negative directional indicators. A large positive spread suggests bullish momentum, while a large negative spread indicates bearish pressure.
Second, On-Balance Volume (OBV) confirms whether volume supports the indicated trend direction. For a Strong Uptrend classification, OBV must be rising above its moving average, confirming that buying pressure backs the price movement.
Third, ADX must exceed a minimum threshold for Strong trend classifications, ensuring that only genuinely trending markets receive the Strong designation.
Signal Generation
Buy and sell signals are generated using Fisher Transform and Aroon indicators, but with a crucial enhancement: the trigger thresholds adjust dynamically based on the current trend state.
The Fisher Transform converts price data into a Gaussian normal distribution, making turning points easier to identify. In a Strong Uptrend, the buy threshold relaxes (making buys easier to trigger) while the sell threshold tightens (making sells harder to trigger). This allows traders to stay in winning positions longer during favorable conditions. The opposite applies in downtrends, where the system becomes quick to exit and reluctant to enter long positions.
The Aroon indicator measures how recently price made a new high or low within the lookback period. Combined with Fisher Transform, this dual-confirmation approach reduces false signals that might occur when using either indicator alone.
Band touches also generate signals. When price reaches the lower band, a potential buy zone is identified. When price reaches the upper band, a potential sell zone is flagged.
Cascade Protection System
A key feature is the built-in protection against averaging down into a losing position. The system tracks consecutive buy signals and limits them to a configurable maximum (default: 3). After reaching this limit, no additional buy signals are generated until a sell signal resets the counter. This prevents the common mistake of repeatedly buying during a sustained decline.
Additionally, the indicator monitors Bollinger Band Width Percentile (BBWP), which measures current volatility relative to historical volatility. When BBWP exceeds a threshold (indicating a volatility spike often associated with sharp moves), buy signals are temporarily frozen. This protects against entering during panic selloffs or blow-off tops.
Extreme Move Detection
Sometimes price moves so aggressively that it penetrates the bands by an unusual amount. The indicator detects these extreme moves and can generate signals even during normal cooldown periods. The logic is that an extreme band penetration represents a significant overextension that warrants attention regardless of recent signal history. These extreme signals are visually distinguished from regular signals.
RSI Divergence
The indicator includes RSI divergence detection as an additional confirmation tool. When price makes a lower low but RSI makes a higher low (bullish divergence), it suggests weakening downside momentum and a potential reversal. Bearish divergence (price higher high, RSI lower high) warns of potential tops. Both regular and hidden divergences are detected and marked on the chart.
Signal Cooldown
To prevent overtrading and signal clustering, a configurable cooldown period prevents new signals for a set number of bars after each signal. This spacing ensures that each signal represents a distinct trading opportunity rather than repeated triggers on the same price movement.
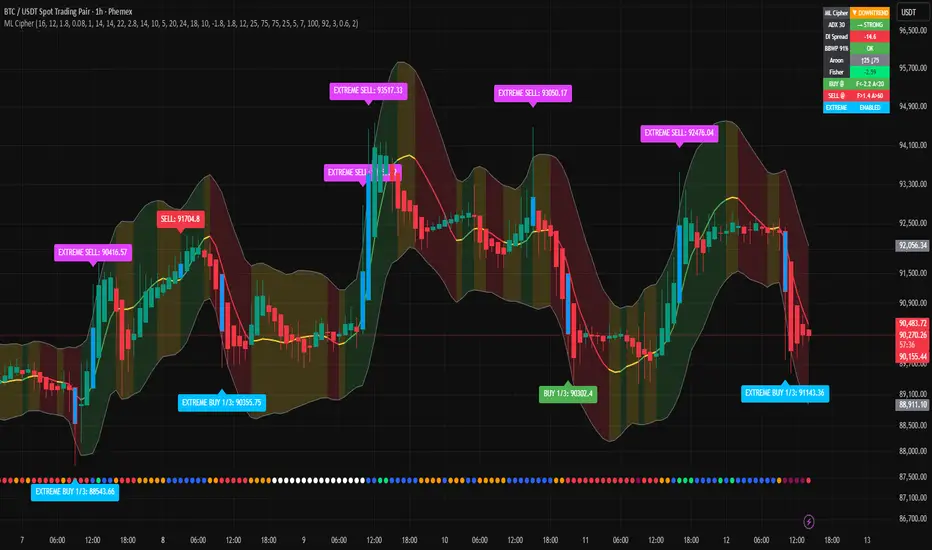
Visual Display
The indicator provides a comprehensive information panel showing current trend state, BBWP status, consecutive buy count, ADX reading, Fisher and Aroon values, cooldown status, and current dynamic thresholds. An ADX bar at the bottom of the chart provides quick visual reference for trend strength and direction using color coding.
Signal labels display the entry or exit price along with the current buy count (for buy signals), helping traders track their position sizing.
How to Use
In uptrending markets, look for buy signals near the lower band, particularly when the trend state shows Uptrend or Strong Uptrend. These represent pullback opportunities within an established trend.
In downtrending markets, the indicator naturally reduces buy signals and increases sell sensitivity, helping traders avoid catching falling knives.
In neutral or ranging conditions, signals from both directions are generated with moderate thresholds, suitable for mean-reversion trading within the bands.
Monitor the BBWP and consecutive buy counter in the info panel. If BBWP shows "FROZEN" or the buy counter approaches the maximum, exercise additional caution with new long entries.
Settings Guidance
The default settings are optimized for 5-minute cryptocurrency charts but can be adjusted for other timeframes and assets. Key parameters to consider adjusting include the Money Line length (shorter for more responsive, longer for smoother), ATR multiplier range (wider bands reduce signals but improve accuracy), and the various threshold values for trend classification.
Overview
MoneyLine Cipher is a trend-following indicator designed to identify high-probability entry and exit points by combining multiple technical analysis methods into a unified signal system. The indicator adapts its behavior based on current market conditions, becoming more aggressive in strong trends and more conservative in choppy or uncertain markets.
Core Concept: The Money Line
At the heart of this indicator is the Money Line, a linear regression line that acts as a dynamic center of price action. Unlike a simple moving average, linear regression fits a straight line through recent prices using least-squares methodology, providing a smoother representation of the underlying trend direction. The slope of this line determines whether the market is in a bullish, bearish, or neutral state.
Dynamic Envelope Bands
The indicator plots upper and lower bands around the Money Line using Average True Range (ATR) as the volatility measure. What makes these bands unique is their adaptive multiplier system. When the ADX (Average Directional Index) indicates a strong trend, the bands automatically widen to accommodate larger price swings and avoid premature exits. In ranging or weak trend conditions, the bands contract to provide tighter entry and exit zones. This dynamic adjustment helps the indicator perform consistently across different market environments.
Trend State Detection
The indicator classifies market conditions into five distinct states: Strong Uptrend, Uptrend, Neutral, Downtrend, and Strong Downtrend. This classification uses three complementary methods working together.
First, the Directional Movement Index (DMI) measures the spread between positive and negative directional indicators. A large positive spread suggests bullish momentum, while a large negative spread indicates bearish pressure.
Second, On-Balance Volume (OBV) confirms whether volume supports the indicated trend direction. For a Strong Uptrend classification, OBV must be rising above its moving average, confirming that buying pressure backs the price movement.
Third, ADX must exceed a minimum threshold for Strong trend classifications, ensuring that only genuinely trending markets receive the Strong designation.
Signal Generation
Buy and sell signals are generated using Fisher Transform and Aroon indicators, but with a crucial enhancement: the trigger thresholds adjust dynamically based on the current trend state.
The Fisher Transform converts price data into a Gaussian normal distribution, making turning points easier to identify. In a Strong Uptrend, the buy threshold relaxes (making buys easier to trigger) while the sell threshold tightens (making sells harder to trigger). This allows traders to stay in winning positions longer during favorable conditions. The opposite applies in downtrends, where the system becomes quick to exit and reluctant to enter long positions.
The Aroon indicator measures how recently price made a new high or low within the lookback period. Combined with Fisher Transform, this dual-confirmation approach reduces false signals that might occur when using either indicator alone.
Band touches also generate signals. When price reaches the lower band, a potential buy zone is identified. When price reaches the upper band, a potential sell zone is flagged.
Cascade Protection System
A key feature is the built-in protection against averaging down into a losing position. The system tracks consecutive buy signals and limits them to a configurable maximum (default: 3). After reaching this limit, no additional buy signals are generated until a sell signal resets the counter. This prevents the common mistake of repeatedly buying during a sustained decline.
Additionally, the indicator monitors Bollinger Band Width Percentile (BBWP), which measures current volatility relative to historical volatility. When BBWP exceeds a threshold (indicating a volatility spike often associated with sharp moves), buy signals are temporarily frozen. This protects against entering during panic selloffs or blow-off tops.
Extreme Move Detection
Sometimes price moves so aggressively that it penetrates the bands by an unusual amount. The indicator detects these extreme moves and can generate signals even during normal cooldown periods. The logic is that an extreme band penetration represents a significant overextension that warrants attention regardless of recent signal history. These extreme signals are visually distinguished from regular signals.
RSI Divergence
The indicator includes RSI divergence detection as an additional confirmation tool. When price makes a lower low but RSI makes a higher low (bullish divergence), it suggests weakening downside momentum and a potential reversal. Bearish divergence (price higher high, RSI lower high) warns of potential tops. Both regular and hidden divergences are detected and marked on the chart.
Signal Cooldown
To prevent overtrading and signal clustering, a configurable cooldown period prevents new signals for a set number of bars after each signal. This spacing ensures that each signal represents a distinct trading opportunity rather than repeated triggers on the same price movement.
Visual Display
The indicator provides a comprehensive information panel showing current trend state, BBWP status, consecutive buy count, ADX reading, Fisher and Aroon values, cooldown status, and current dynamic thresholds. An ADX bar at the bottom of the chart provides quick visual reference for trend strength and direction using color coding.
Signal labels display the entry or exit price along with the current buy count (for buy signals), helping traders track their position sizing.
How to Use
In uptrending markets, look for buy signals near the lower band, particularly when the trend state shows Uptrend or Strong Uptrend. These represent pullback opportunities within an established trend.
In downtrending markets, the indicator naturally reduces buy signals and increases sell sensitivity, helping traders avoid catching falling knives.
In neutral or ranging conditions, signals from both directions are generated with moderate thresholds, suitable for mean-reversion trading within the bands.
Monitor the BBWP and consecutive buy counter in the info panel. If BBWP shows "FROZEN" or the buy counter approaches the maximum, exercise additional caution with new long entries.
Settings Guidance
The default settings are optimized for 5-minute cryptocurrency charts but can be adjusted for other timeframes and assets. Key parameters to consider adjusting include the Money Line length (shorter for more responsive, longer for smoother), ATR multiplier range (wider bands reduce signals but improve accuracy), and the various threshold values for trend classification.
릴리즈 노트
MoneyLine Cipher v2 - ChangelogHarmonized ADX/DI Trend Logic
The trend state detection has been completely reworked to eliminate gaps in the classification logic. Previously, certain combinations of ADX and DI spread values fell through the cracks and received illogical classifications. Now the system uses two clean thresholds: ADX must exceed 18 to trade at all (below this is RANGING), and ADX must exceed 24 for STRONG trend states. DI spread determines direction (above 5 = uptrend, above 10 = strong, negative values for downtrend). Every ADX/DI combination now maps to a sensible state with no paradoxes.
RANGING State Added
When ADX drops to 18 or below, the market is classified as RANGING. In this state, all regular buy and sell signals are blocked to prevent whipsaws in choppy conditions. However, EXTREME signals (deep band penetrations) still fire - these are the only signals allowed during ranging periods. The info panel shows "EXTREME: ONLY MODE" when ranging is active.
RSI Divergence Removed
The RSI divergence detection code has been completely removed. It was computing divergences but not integrating them into the signal logic - purely cosmetic overhead. Removing it reduces script complexity and improves performance.
Volume Spike Highlighting Added
Candles with unusually high volume now get a subtle fuchsia background glow. The default threshold is 2x the 20-bar average volume, adjustable from 1.1x to 5x. This helps identify candles with institutional participation or significant market interest without interfering with existing signal coloring.
Streamlined Info Panel
The info panel has been reorganized to 9 rows. Removed: Divergence row, Buy Counter row, Cooldown row. Added: DI Spread row with color coding (lime for strong bullish above 10, blue for bullish 5-10, gray for neutral, orange for bearish, red for strong bearish below -10). The ADX row now shows BLOCKED/TREND/STRONG status. The EXTREME row shows "ONLY MODE" when ranging or "ENABLED" otherwise.
ADX Bar Color Logic Updated
The ADX bar at the bottom of the chart now reflects the harmonized trend states including the new RANGING state (white). Colors match the trend classification: lime for strong uptrend, blue for uptrend, orange for neutral, red for downtrend, maroon for strong downtrend, white for ranging.
오픈 소스 스크립트
트레이딩뷰의 진정한 정신에 따라, 이 스크립트의 작성자는 이를 오픈소스로 공개하여 트레이더들이 기능을 검토하고 검증할 수 있도록 했습니다. 작성자에게 찬사를 보냅니다! 이 코드는 무료로 사용할 수 있지만, 코드를 재게시하는 경우 하우스 룰이 적용된다는 점을 기억하세요.
면책사항
해당 정보와 게시물은 금융, 투자, 트레이딩 또는 기타 유형의 조언이나 권장 사항으로 간주되지 않으며, 트레이딩뷰에서 제공하거나 보증하는 것이 아닙니다. 자세한 내용은 이용 약관을 참조하세요.
오픈 소스 스크립트
트레이딩뷰의 진정한 정신에 따라, 이 스크립트의 작성자는 이를 오픈소스로 공개하여 트레이더들이 기능을 검토하고 검증할 수 있도록 했습니다. 작성자에게 찬사를 보냅니다! 이 코드는 무료로 사용할 수 있지만, 코드를 재게시하는 경우 하우스 룰이 적용된다는 점을 기억하세요.
면책사항
해당 정보와 게시물은 금융, 투자, 트레이딩 또는 기타 유형의 조언이나 권장 사항으로 간주되지 않으며, 트레이딩뷰에서 제공하거나 보증하는 것이 아닙니다. 자세한 내용은 이용 약관을 참조하세요.