INVITE-ONLY SCRIPT
업데이트됨 Nifty Trendometer - Nifty 50 Live Tracker
🚀 Nifty Trendometer — The Ultimate Live Market Tracker for the Nifty 50 🚀
🔍 One glance, total clarity. One tool, total control.
The Nifty Trendometer is a next-generation TradingView indicator designed for serious traders and portfolio managers who want to see what institutions see. It merges advanced demand–supply analytics, live breadth monitoring, and macro stress signals — all in one clean, self-updating dashboard.
🧭 What It Does?
Tracks Nifty 50 internals live: See how many of India’s top 30 stocks are gaining, losing, or collapsing beyond key thresholds.
Identifies actionable demand and supply zones: The algorithm automatically scans for low-volume demand zones, supply imbalances, and high-volume consolidation clusters (HVNs) — letting you spot where smart money is active.
Generates precision buy/sell decisions: Smart zone-touch detection coupled with real-time volume validation gives you high-confidence reversal or breakout signals — without repainting.
Measures macro risk instantly: Integrated India VIX, USDINR, Bank Index, and Basis stress readings tell you when the market’s underlying engine is overheating or calming down.
⚡ Key Highlights
✅ Dynamic Zone Mapping — Automatically highlights fresh demand (green), supply (purple), and HVN (blue) regions as they form — no manual drawing needed.
✅ Smart Volume Logic — Detects price reactions backed by significant volume surges — confirming genuine breakouts, not noise.
✅ Crash & Rally Detector — A proprietary “Crash Probability” engine calculates live risk and momentum balance, showing how close the market is to tipping into panic or breakout.
✅ ORB & Gap Analysis — Monitors intraday open-range breakouts, gap fades, and continuation patterns with volatility confirmation.
✅ Macro Stress Dashboard — Instantly shows whether India’s market risk is local, global, or liquidity-driven — using DXY-relative INR movement, bank index health, and basis stress.
✅ Smart Alerts — Be notified automatically when the system detects:
• Crash Symptoms (Warning)
• Crash Confirmation (Crisis)
• Rally Watch
• Rally Start (Go Signal)
🧠 The Logic — Simplified
The Trendometer combines the following:
Volume profile geometry (for hidden demand/supply zones)
Price reaction mapping (for confirmed reversals and rejections)
Multi-factor stress scoring (VIX, currency, banks, basis, and breadth)
Probability modeling (a smooth blend of seven risk dimensions, scaled to a live “Crash–Rally Probability” score)
Everything updates tick-by-tick, producing a dynamic, data-driven market weather report.
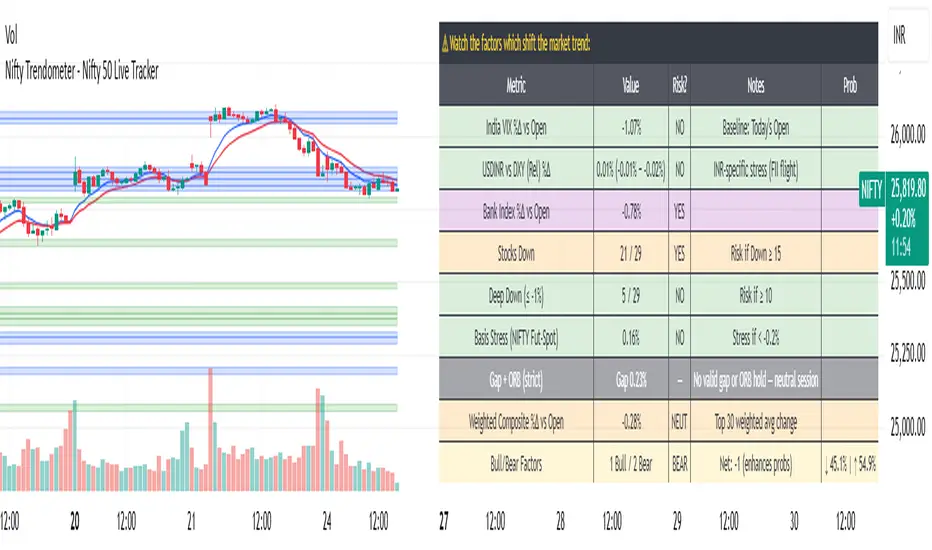
📊 One Dashboard, Infinite Insight
The indicator creates a compact, color-coded table on your TradingView chart showing:
VIX % change
USDINR strength (absolute or DXY-relative)
Bank index trend
Nifty breadth and depth (number of stocks down / deeply down)
Basis stress (futures vs spot)
ORB/gap behavior
Overall crash or rally probability (e.g., “↓ 68% | ↑ 32%”)
Visual cues instantly shift from green (safe) to orange (watch) to red (crisis) — no guessing required.
💡 Ideal For:
Intraday traders seeking early directional bias confirmation
Swing traders spotting reversals at demand/supply pivots
Investors wanting macro stress signals before volatility spikes
Quant-oriented analysts tracking multi-factor market health
⚙️ Plug-and-Trade Simplicity
Just add the Nifty Trendometer to your TradingView chart and watch the market structure, sentiment, and institutional footprints reveal themselves in real time.
No parameter tuning. No manual drawing. No data delays.
📈 Nifty Trendometer — When precision meets perspective.
Because the best traders don’t predict — they measure the factors which affect the market.
🔍 One glance, total clarity. One tool, total control.
The Nifty Trendometer is a next-generation TradingView indicator designed for serious traders and portfolio managers who want to see what institutions see. It merges advanced demand–supply analytics, live breadth monitoring, and macro stress signals — all in one clean, self-updating dashboard.
🧭 What It Does?
Tracks Nifty 50 internals live: See how many of India’s top 30 stocks are gaining, losing, or collapsing beyond key thresholds.
Identifies actionable demand and supply zones: The algorithm automatically scans for low-volume demand zones, supply imbalances, and high-volume consolidation clusters (HVNs) — letting you spot where smart money is active.
Generates precision buy/sell decisions: Smart zone-touch detection coupled with real-time volume validation gives you high-confidence reversal or breakout signals — without repainting.
Measures macro risk instantly: Integrated India VIX, USDINR, Bank Index, and Basis stress readings tell you when the market’s underlying engine is overheating or calming down.
⚡ Key Highlights
✅ Dynamic Zone Mapping — Automatically highlights fresh demand (green), supply (purple), and HVN (blue) regions as they form — no manual drawing needed.
✅ Smart Volume Logic — Detects price reactions backed by significant volume surges — confirming genuine breakouts, not noise.
✅ Crash & Rally Detector — A proprietary “Crash Probability” engine calculates live risk and momentum balance, showing how close the market is to tipping into panic or breakout.
✅ ORB & Gap Analysis — Monitors intraday open-range breakouts, gap fades, and continuation patterns with volatility confirmation.
✅ Macro Stress Dashboard — Instantly shows whether India’s market risk is local, global, or liquidity-driven — using DXY-relative INR movement, bank index health, and basis stress.
✅ Smart Alerts — Be notified automatically when the system detects:
• Crash Symptoms (Warning)
• Crash Confirmation (Crisis)
• Rally Watch
• Rally Start (Go Signal)
🧠 The Logic — Simplified
The Trendometer combines the following:
Volume profile geometry (for hidden demand/supply zones)
Price reaction mapping (for confirmed reversals and rejections)
Multi-factor stress scoring (VIX, currency, banks, basis, and breadth)
Probability modeling (a smooth blend of seven risk dimensions, scaled to a live “Crash–Rally Probability” score)
Everything updates tick-by-tick, producing a dynamic, data-driven market weather report.
📊 One Dashboard, Infinite Insight
The indicator creates a compact, color-coded table on your TradingView chart showing:
VIX % change
USDINR strength (absolute or DXY-relative)
Bank index trend
Nifty breadth and depth (number of stocks down / deeply down)
Basis stress (futures vs spot)
ORB/gap behavior
Overall crash or rally probability (e.g., “↓ 68% | ↑ 32%”)
Visual cues instantly shift from green (safe) to orange (watch) to red (crisis) — no guessing required.
💡 Ideal For:
Intraday traders seeking early directional bias confirmation
Swing traders spotting reversals at demand/supply pivots
Investors wanting macro stress signals before volatility spikes
Quant-oriented analysts tracking multi-factor market health
⚙️ Plug-and-Trade Simplicity
Just add the Nifty Trendometer to your TradingView chart and watch the market structure, sentiment, and institutional footprints reveal themselves in real time.
No parameter tuning. No manual drawing. No data delays.
📈 Nifty Trendometer — When precision meets perspective.
Because the best traders don’t predict — they measure the factors which affect the market.
릴리즈 노트
Update: Probability Calculations are overhauled after testing.릴리즈 노트
Update: Table Display Updated.릴리즈 노트
Update: Minor Bug Fixes초대 전용 스크립트
이 스크립트는 작성자가 승인한 사용자만 접근할 수 있습니다. 사용하려면 요청을 보내고 승인을 받아야 합니다. 일반적으로 결제 후에 승인이 이루어집니다. 자세한 내용은 아래 작성자의 지침을 따르거나 jellygill에게 직접 문의하세요.
트레이딩뷰는 스크립트 작성자를 완전히 신뢰하고 스크립트 작동 방식을 이해하지 않는 한 스크립트 비용을 지불하거나 사용하지 않는 것을 권장하지 않습니다. 무료 오픈소스 대체 스크립트는 커뮤니티 스크립트에서 찾을 수 있습니다.
작성자 지시 사항
Get connected via Telegram ID @jellygill for free trial.
To avail FREE TRIAL for all our invite-only indicators, please contact us:
Telegram: @jellygill
Our Telegram Channel: @CheetaTrader
join to complete FREE TRAINING on how to use the indicators effectively and then request @jellygill for FREE TRIAL
Telegram: @jellygill
Our Telegram Channel: @CheetaTrader
join to complete FREE TRAINING on how to use the indicators effectively and then request @jellygill for FREE TRIAL
면책사항
이 정보와 게시물은 TradingView에서 제공하거나 보증하는 금융, 투자, 거래 또는 기타 유형의 조언이나 권고 사항을 의미하거나 구성하지 않습니다. 자세한 내용은 이용 약관을 참고하세요.
초대 전용 스크립트
이 스크립트는 작성자가 승인한 사용자만 접근할 수 있습니다. 사용하려면 요청을 보내고 승인을 받아야 합니다. 일반적으로 결제 후에 승인이 이루어집니다. 자세한 내용은 아래 작성자의 지침을 따르거나 jellygill에게 직접 문의하세요.
트레이딩뷰는 스크립트 작성자를 완전히 신뢰하고 스크립트 작동 방식을 이해하지 않는 한 스크립트 비용을 지불하거나 사용하지 않는 것을 권장하지 않습니다. 무료 오픈소스 대체 스크립트는 커뮤니티 스크립트에서 찾을 수 있습니다.
작성자 지시 사항
Get connected via Telegram ID @jellygill for free trial.
To avail FREE TRIAL for all our invite-only indicators, please contact us:
Telegram: @jellygill
Our Telegram Channel: @CheetaTrader
join to complete FREE TRAINING on how to use the indicators effectively and then request @jellygill for FREE TRIAL
Telegram: @jellygill
Our Telegram Channel: @CheetaTrader
join to complete FREE TRAINING on how to use the indicators effectively and then request @jellygill for FREE TRIAL
면책사항
이 정보와 게시물은 TradingView에서 제공하거나 보증하는 금융, 투자, 거래 또는 기타 유형의 조언이나 권고 사항을 의미하거나 구성하지 않습니다. 자세한 내용은 이용 약관을 참고하세요.