OPEN-SOURCE SCRIPT
업데이트됨 HTF Overlay Candles (Aggregated)
🕯️ Synthetic Aggregated Candles
Created by: The_Forex_Steward
License: Mozilla Public License 2.0
🔍 Description
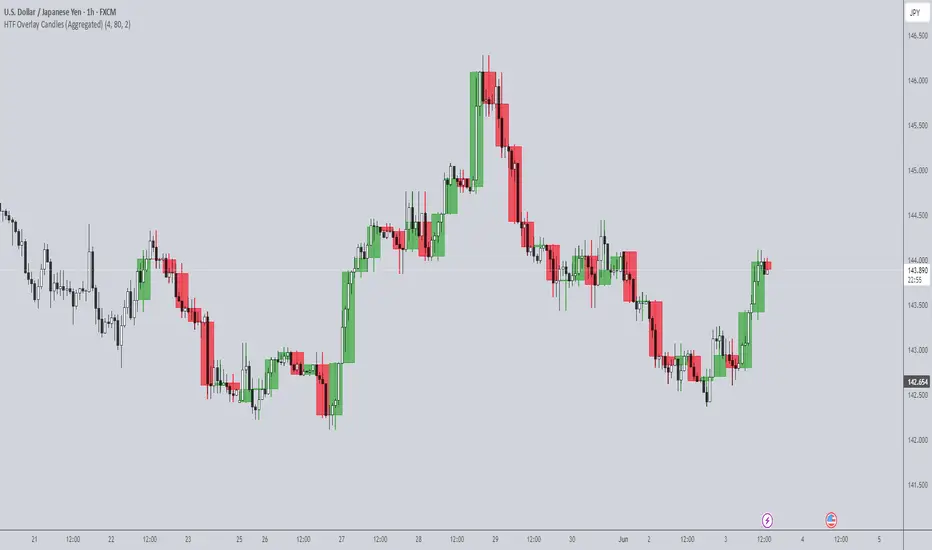
This indicator creates visually aggregated candles directly on your chart, allowing you to view synthetic candlesticks that combine multiple bars into one. It enables a higher-level perspective of price action without switching timeframes.
Each synthetic candle is built by combining a user-defined number of consecutive bars (e.g., 4 bars from the current timeframe form one aggregated candle). It accurately tracks open, high, low, and close values, then draws a colored box and wick to represent the aggregated data.
⚙️ Features
📌 Use Case
Ideal for traders looking to:
- Reduce noise in lower timeframes
- Visualize price action in broader chunks
- Spot larger structure and swing patterns without switching charts
📈 How It Works
At every bar, the script checks whether a new aggregation interval has begun (aligned to the day start). If so, it finalizes the previous candle and starts a new one. On the last bar of the chart, it ensures the final synthetic candle is drawn.
✅ Tip
For best results, apply this script on intraday timeframes and experiment with different aggregation factors (4, 6, 12, etc.) to discover the most insightful compression for your strategy.
Note: This script is optimized for visual representation only. It does not repaint, but it is not intended for algorithmic strategies or alerts.
Created by: The_Forex_Steward
License: Mozilla Public License 2.0
🔍 Description
This indicator creates visually aggregated candles directly on your chart, allowing you to view synthetic candlesticks that combine multiple bars into one. It enables a higher-level perspective of price action without switching timeframes.
Each synthetic candle is built by combining a user-defined number of consecutive bars (e.g., 4 bars from the current timeframe form one aggregated candle). It accurately tracks open, high, low, and close values, then draws a colored box and wick to represent the aggregated data.
⚙️ Features
- Aggregation Factor: Combine candles over a custom number of bars (e.g., 4 = 4x current TF)
- Timezone Alignment: Aggregation is aligned with midnight in UTC-5 (modifiable in code)
- Custom Colors: Choose colors for bullish and bearish synthetic candles
- Body Opacity: Control the opacity of the candle body for visual clarity
- Wick Width: Customize the thickness of the candle wick
📌 Use Case
Ideal for traders looking to:
- Reduce noise in lower timeframes
- Visualize price action in broader chunks
- Spot larger structure and swing patterns without switching charts
📈 How It Works
At every bar, the script checks whether a new aggregation interval has begun (aligned to the day start). If so, it finalizes the previous candle and starts a new one. On the last bar of the chart, it ensures the final synthetic candle is drawn.
✅ Tip
For best results, apply this script on intraday timeframes and experiment with different aggregation factors (4, 6, 12, etc.) to discover the most insightful compression for your strategy.
Note: This script is optimized for visual representation only. It does not repaint, but it is not intended for algorithmic strategies or alerts.
릴리즈 노트
agg close logic updated오픈 소스 스크립트
트레이딩뷰의 진정한 정신에 따라, 이 스크립트의 작성자는 이를 오픈소스로 공개하여 트레이더들이 기능을 검토하고 검증할 수 있도록 했습니다. 작성자에게 찬사를 보냅니다! 이 코드는 무료로 사용할 수 있지만, 코드를 재게시하는 경우 하우스 룰이 적용된다는 점을 기억하세요.
면책사항
해당 정보와 게시물은 금융, 투자, 트레이딩 또는 기타 유형의 조언이나 권장 사항으로 간주되지 않으며, 트레이딩뷰에서 제공하거나 보증하는 것이 아닙니다. 자세한 내용은 이용 약관을 참조하세요.
오픈 소스 스크립트
트레이딩뷰의 진정한 정신에 따라, 이 스크립트의 작성자는 이를 오픈소스로 공개하여 트레이더들이 기능을 검토하고 검증할 수 있도록 했습니다. 작성자에게 찬사를 보냅니다! 이 코드는 무료로 사용할 수 있지만, 코드를 재게시하는 경우 하우스 룰이 적용된다는 점을 기억하세요.
면책사항
해당 정보와 게시물은 금융, 투자, 트레이딩 또는 기타 유형의 조언이나 권장 사항으로 간주되지 않으며, 트레이딩뷰에서 제공하거나 보증하는 것이 아닙니다. 자세한 내용은 이용 약관을 참조하세요.