OPEN-SOURCE SCRIPT
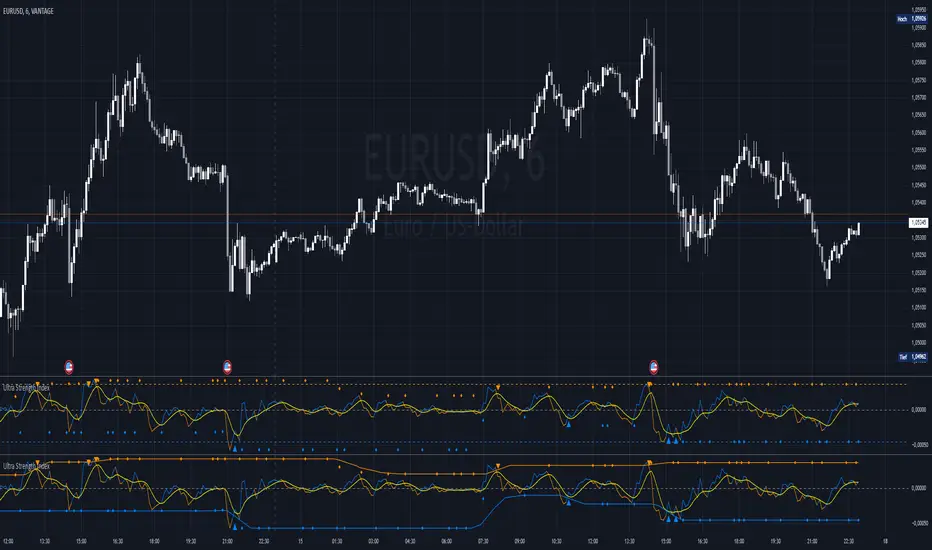
Ultra Strength Index

The Ultra Strength Index is a momentum-based indicator designed to enhance price action analysis. It identifies overbought/oversold levels and generates buy/sell signals based on momentum shifts. With customizable smoothing and dynamic updates, it suits both trend-following and reversal strategies.
Introduction
The Ultra Strength Index is a powerful tool designed to help traders analyze price momentum, identify trends, and recognize potential turning points in the market. By combining advanced smoothing techniques and customizable settings, it provides a clear visual representation of overbought/oversold conditions and momentum signals, making it suitable for all trading styles.
Detailed Description
The Ultra Strength Index works by analyzing price momentum and visualizing it through smoothed calculations.
Here's how it works:
.........
.........
Customizable colors, smoothing periods, and signal settings allow traders to tailor the indicator to their strategy.
Special Thanks
I use the TWMA-Function created from RedKTrader to smooth the values.
Special thanks to him/her for creating and sharing this function!
Introduction
The Ultra Strength Index is a powerful tool designed to help traders analyze price momentum, identify trends, and recognize potential turning points in the market. By combining advanced smoothing techniques and customizable settings, it provides a clear visual representation of overbought/oversold conditions and momentum signals, making it suitable for all trading styles.
Detailed Description
The Ultra Strength Index works by analyzing price momentum and visualizing it through smoothed calculations.
Here's how it works:
.........
- Impulse Line
Tracks changes in price momentum using a simple moving average (SMA) of the price change. This line reflects the strength and direction of momentum.
..... - Signal Line
A more stable, smoother version of the impulse line, calculated using a Triple Weigthend Moving Average (TWMA) wich created RedKTrader. It acts as a baseline to compare momentum shifts.
..... - Overbought/Oversold Zones
The indicator detects extreme price conditions using historical momentum levels. These levels are dynamically smoothed over a customizable lookback period to minimize noise and ensure reliability.
..... - Repainting Feature
The "Enable Repaint" option offers real-time updating of overbought/oversold levels for more reactive signals, while disabling it provides the actual level for retrospective analysis.
..... - Buy and Sell Signals
The impulse line crosses into or out of overbought/oversold zones. (Triangle)
The impulse line crosses above or below the signal line, indicating potential momentum shifts. (Diamond)
.........
Customizable colors, smoothing periods, and signal settings allow traders to tailor the indicator to their strategy.
Special Thanks
I use the TWMA-Function created from RedKTrader to smooth the values.
Special thanks to him/her for creating and sharing this function!
오픈 소스 스크립트
트레이딩뷰의 진정한 정신에 따라, 이 스크립트의 작성자는 이를 오픈소스로 공개하여 트레이더들이 기능을 검토하고 검증할 수 있도록 했습니다. 작성자에게 찬사를 보냅니다! 이 코드는 무료로 사용할 수 있지만, 코드를 재게시하는 경우 하우스 룰이 적용된다는 점을 기억하세요.
면책사항
해당 정보와 게시물은 금융, 투자, 트레이딩 또는 기타 유형의 조언이나 권장 사항으로 간주되지 않으며, 트레이딩뷰에서 제공하거나 보증하는 것이 아닙니다. 자세한 내용은 이용 약관을 참조하세요.
오픈 소스 스크립트
트레이딩뷰의 진정한 정신에 따라, 이 스크립트의 작성자는 이를 오픈소스로 공개하여 트레이더들이 기능을 검토하고 검증할 수 있도록 했습니다. 작성자에게 찬사를 보냅니다! 이 코드는 무료로 사용할 수 있지만, 코드를 재게시하는 경우 하우스 룰이 적용된다는 점을 기억하세요.
면책사항
해당 정보와 게시물은 금융, 투자, 트레이딩 또는 기타 유형의 조언이나 권장 사항으로 간주되지 않으며, 트레이딩뷰에서 제공하거나 보증하는 것이 아닙니다. 자세한 내용은 이용 약관을 참조하세요.