INVITE-ONLY SCRIPT
업데이트됨 Lachie 5.0.1.2: DDS (Divergence Detection System)
Introduction:
The purpose of this indicator is to assist users in detecting bullish and bearish divergence. This is purely for educational purposes and should only be used as an indicator to invest further time in TA.
This indicator is a further release of my previous indicator Lachie 3.0: DDS (Divergence Detection System).
How to interpret:
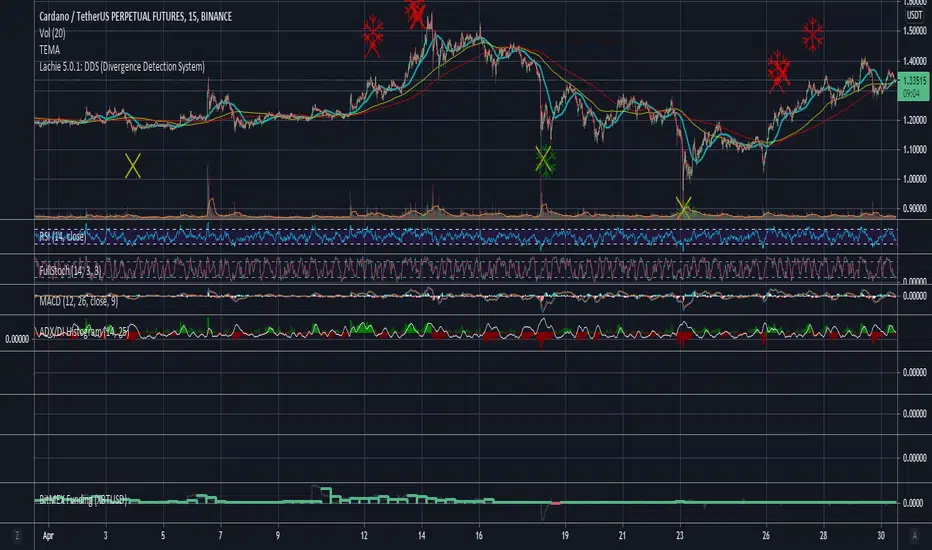
When a unique event occurs in the market the logic of the code will trigger:
-Bullish Divergence: Yellow X = divergence detected/forming, Orange X = strong confirmation, Green snow flake = targets end of divergence (fails sometimes)
-Bearish Divergence: Red X = Divergence detected/forming, Red snow flake = attempts to hit end of divergence/peaks
The chart may draw several characters in one location usually adding to the strength of the divergence.
What should I do when a character is painted on my chart:
As this is an educational indicator, I can only recommend that once a character(s) is drawn you should pay further attention to the currency/stock (do further Technical Analysis ). Treat this indicator as a hunting dog, looking for areas for you to investigate. You don’t give your dog the gun so please do not link it to automation and get tilted when something doesn’t go quite your way.
What time frames is this indicator best on:
This indicator was designed on a 1 hour chart. However, it does perform quite well on the daily, 4 and 6 hour charts. Its performance is reduced on 15 and 5 min since previous release (Lachie 3.0: DDS (Divergence Detection System)).
FAQ:
Should I Buy/Long when I see a bullish indicators?
I will not recommend any purchases without first proper TA. Majority of the time the indicator will correctly fin the bottom however in extreme down trends the code will display fake characters. Upon proper TA you will see how these are fake, but if you rely on a signal, you may get caught out.
Should I Sell/Short when I see a bearish indicators?
Only on 125x leve..... nope, please use this for educational purposes until full versions is released.
I am getting too many characters on my chart?
Although this was worked on heavily since previous release you may still encounter numerous characters in one place, for now this is quite normal and can happen when:
-High strength divergence.
-In a down trend occasionally the logic cannot correct interpret the weakness in the market.
Is this indicator applicable to any market?
Yes, although the indicator was developed based on Crypto Currency markets, the indicator is usable and in most instances more accurate on traditional markets.
Will there be future updates released?
As the code ages and further development is made, updates including increase accuracy for automation and signals may be released. This is really released for educational support. These updates may be released under a separate indicator listing.
This is an earlier derivative of current indicator with bullish and bearish divergence with higher accuracy (signal) script.
For access (vendor requirement):
Please contact me via private message on Trading View.
Images of Indicator:


Previous versions:
Lachie 3.0: DDS (Divergence Detection System)
Created and owned by Lachlan Schahinger. (2019)
The purpose of this indicator is to assist users in detecting bullish and bearish divergence. This is purely for educational purposes and should only be used as an indicator to invest further time in TA.
This indicator is a further release of my previous indicator Lachie 3.0: DDS (Divergence Detection System).
How to interpret:
When a unique event occurs in the market the logic of the code will trigger:
-Bullish Divergence: Yellow X = divergence detected/forming, Orange X = strong confirmation, Green snow flake = targets end of divergence (fails sometimes)
-Bearish Divergence: Red X = Divergence detected/forming, Red snow flake = attempts to hit end of divergence/peaks
The chart may draw several characters in one location usually adding to the strength of the divergence.
What should I do when a character is painted on my chart:
As this is an educational indicator, I can only recommend that once a character(s) is drawn you should pay further attention to the currency/stock (do further Technical Analysis ). Treat this indicator as a hunting dog, looking for areas for you to investigate. You don’t give your dog the gun so please do not link it to automation and get tilted when something doesn’t go quite your way.
What time frames is this indicator best on:
This indicator was designed on a 1 hour chart. However, it does perform quite well on the daily, 4 and 6 hour charts. Its performance is reduced on 15 and 5 min since previous release (Lachie 3.0: DDS (Divergence Detection System)).
FAQ:
Should I Buy/Long when I see a bullish indicators?
I will not recommend any purchases without first proper TA. Majority of the time the indicator will correctly fin the bottom however in extreme down trends the code will display fake characters. Upon proper TA you will see how these are fake, but if you rely on a signal, you may get caught out.
Should I Sell/Short when I see a bearish indicators?
Only on 125x leve..... nope, please use this for educational purposes until full versions is released.
I am getting too many characters on my chart?
Although this was worked on heavily since previous release you may still encounter numerous characters in one place, for now this is quite normal and can happen when:
-High strength divergence.
-In a down trend occasionally the logic cannot correct interpret the weakness in the market.
Is this indicator applicable to any market?
Yes, although the indicator was developed based on Crypto Currency markets, the indicator is usable and in most instances more accurate on traditional markets.
Will there be future updates released?
As the code ages and further development is made, updates including increase accuracy for automation and signals may be released. This is really released for educational support. These updates may be released under a separate indicator listing.
This is an earlier derivative of current indicator with bullish and bearish divergence with higher accuracy (signal) script.
For access (vendor requirement):
Please contact me via private message on Trading View.
Images of Indicator:
Previous versions:
Lachie 3.0: DDS (Divergence Detection System)
Created and owned by Lachlan Schahinger. (2019)
릴리즈 노트
Legacy Support Update:- Added alerts for Rask...
초대 전용 스크립트
이 스크립트는 작성자가 승인한 사용자만 접근할 수 있습니다. 사용하려면 요청 후 승인을 받아야 하며, 일반적으로 결제 후에 허가가 부여됩니다. 자세한 내용은 아래 작성자의 안내를 따르거나 SilentXD에게 직접 문의하세요.
트레이딩뷰는 스크립트의 작동 방식을 충분히 이해하고 작성자를 완전히 신뢰하지 않는 이상, 해당 스크립트에 비용을 지불하거나 사용하는 것을 권장하지 않습니다. 커뮤니티 스크립트에서 무료 오픈소스 대안을 찾아보실 수도 있습니다.
작성자 지시 사항
PM on TV to access.
면책사항
해당 정보와 게시물은 금융, 투자, 트레이딩 또는 기타 유형의 조언이나 권장 사항으로 간주되지 않으며, 트레이딩뷰에서 제공하거나 보증하는 것이 아닙니다. 자세한 내용은 이용 약관을 참조하세요.