PROTECTED SOURCE SCRIPT
업데이트됨 Ultimate Average 3.0
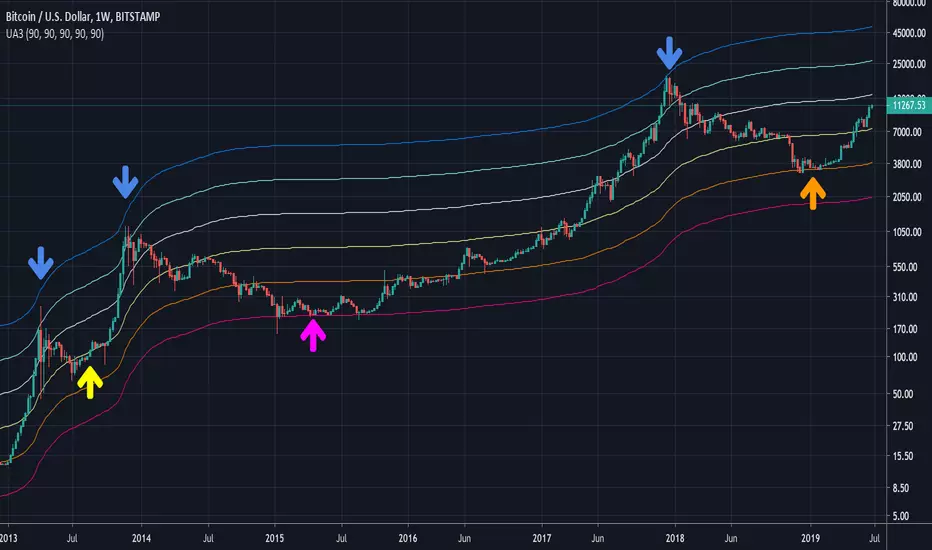
Purple = Actual average price over total timeframe.
Other lines are factors above the actual average.
A pattern emerges where the purple is hit, then a parabolic rise to the blue top, then the a drawback down to the orange, then parabolic, then drawback to yellow, then parabolic to blue, then a reset back to the purple line.
Other lines are factors above the actual average.
A pattern emerges where the purple is hit, then a parabolic rise to the blue top, then the a drawback down to the orange, then parabolic, then drawback to yellow, then parabolic to blue, then a reset back to the purple line.
릴리즈 노트
updates timescale automation보호된 스크립트입니다
이 스크립트는 비공개 소스로 게시됩니다. 하지만 이를 자유롭게 제한 없이 사용할 수 있습니다 – 자세한 내용은 여기에서 확인하세요.
면책사항
해당 정보와 게시물은 금융, 투자, 트레이딩 또는 기타 유형의 조언이나 권장 사항으로 간주되지 않으며, 트레이딩뷰에서 제공하거나 보증하는 것이 아닙니다. 자세한 내용은 이용 약관을 참조하세요.
보호된 스크립트입니다
이 스크립트는 비공개 소스로 게시됩니다. 하지만 이를 자유롭게 제한 없이 사용할 수 있습니다 – 자세한 내용은 여기에서 확인하세요.
면책사항
해당 정보와 게시물은 금융, 투자, 트레이딩 또는 기타 유형의 조언이나 권장 사항으로 간주되지 않으며, 트레이딩뷰에서 제공하거나 보증하는 것이 아닙니다. 자세한 내용은 이용 약관을 참조하세요.