OPEN-SOURCE SCRIPT
업데이트됨 Consecutive Momentum

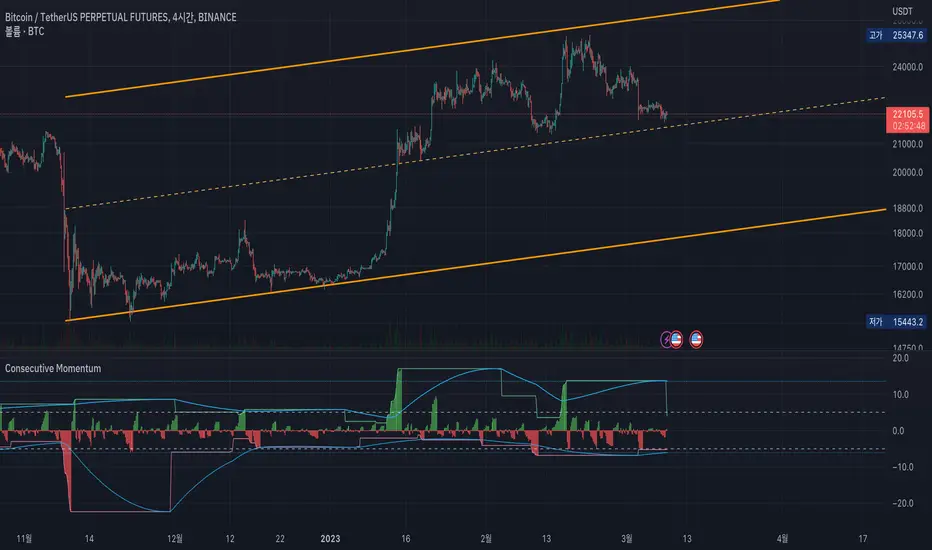
This is a momentum indicator that measures how much fluctuation has occurred in the direction of the consecutive candle.
The green line at the upper of the indicator shows the maximum rise over the set period (default is 120 candles).
Likewise, the red line at the bottom shows the biggest drop.
The blue line shows the average of the maximum fluctuation width.
---

For example, in the picture above, the green vertical line means that consecutive fallen goes beyond the average level.
Also, the red vertical line shows that the consecutive rising exceeds the average level.
---
Uncheck the 'Show Direction' check box to show the values as absolute values.
In addition, if you select the 'Show Consecutive Candle' option, you can see how many consecutive candles have been occurred.
---
Since You may be able to trade against the trend outside of the above average rise/fall,
through this indicator, I wanted to express a situation that requires risk management such as "It is overheat than usual, so I should wait for a retracement."
I hope this helps you.
------------------------------
이 지표는, 양봉 혹은 음봉이 연속적으로 발생할 때의 변동폭을 보여주는 모멘텀 지표입니다.
지표 상단의 녹색 선은 설정된 기간 동안 최대 상승폭을 나타냅니다(기본값은 120캔들).
마찬가지로 하단의 붉은색 선은 설정된 기간동안의 최대 하락폭을 보여줍니다.
하늘색 선은 이러한 최대 변동 폭의 평균을 가중평균으로 계산하였습니다.
---

예를 들어, 위의 그림에서 녹색 수직선은 연속적으로 하락한 것이 평균 수준을 초과한다는 것을 의미합니다.
또한 빨간색 수직선은 연속적인 상승폭이 이 평균 수준을 초과한다는 것을 보여줍니다.
---
음봉을 절댓값으로 보고 싶다면 'Show Direction'체크박스를 해제하시면 됩니다.
이 경우 '평균적인 최대 상승/하락폭'은 연속적인 양봉음봉의 평균으로 표기됩니다.
맨 아래에 있는 선택란에 'Show Consecutive Candle' 옵션을 선택하면, 연속적인 양봉 음봉의 갯수를 보여주는 상태로 바뀝니다.
---
당장 위와 같은 평균적인 연속 양봉의 상승/음봉의 하락폭을 벗어나는 자리에서 역추세매매를 할수도 있겠지만,
저는 이 지표를 통해 '평상시보다 과열 상태이니 되돌림을 기다려야겠다'와 같은 리스크 관리가 필요한 상태를 표현하고 싶었습니다.
잘 이용해주시면 감사하겠습니다.
The green line at the upper of the indicator shows the maximum rise over the set period (default is 120 candles).
Likewise, the red line at the bottom shows the biggest drop.
The blue line shows the average of the maximum fluctuation width.
---
For example, in the picture above, the green vertical line means that consecutive fallen goes beyond the average level.
Also, the red vertical line shows that the consecutive rising exceeds the average level.
---
Uncheck the 'Show Direction' check box to show the values as absolute values.
In addition, if you select the 'Show Consecutive Candle' option, you can see how many consecutive candles have been occurred.
---
Since You may be able to trade against the trend outside of the above average rise/fall,
through this indicator, I wanted to express a situation that requires risk management such as "It is overheat than usual, so I should wait for a retracement."
I hope this helps you.
------------------------------
이 지표는, 양봉 혹은 음봉이 연속적으로 발생할 때의 변동폭을 보여주는 모멘텀 지표입니다.
지표 상단의 녹색 선은 설정된 기간 동안 최대 상승폭을 나타냅니다(기본값은 120캔들).
마찬가지로 하단의 붉은색 선은 설정된 기간동안의 최대 하락폭을 보여줍니다.
하늘색 선은 이러한 최대 변동 폭의 평균을 가중평균으로 계산하였습니다.
---
예를 들어, 위의 그림에서 녹색 수직선은 연속적으로 하락한 것이 평균 수준을 초과한다는 것을 의미합니다.
또한 빨간색 수직선은 연속적인 상승폭이 이 평균 수준을 초과한다는 것을 보여줍니다.
---
음봉을 절댓값으로 보고 싶다면 'Show Direction'체크박스를 해제하시면 됩니다.
이 경우 '평균적인 최대 상승/하락폭'은 연속적인 양봉음봉의 평균으로 표기됩니다.
맨 아래에 있는 선택란에 'Show Consecutive Candle' 옵션을 선택하면, 연속적인 양봉 음봉의 갯수를 보여주는 상태로 바뀝니다.
---
당장 위와 같은 평균적인 연속 양봉의 상승/음봉의 하락폭을 벗어나는 자리에서 역추세매매를 할수도 있겠지만,
저는 이 지표를 통해 '평상시보다 과열 상태이니 되돌림을 기다려야겠다'와 같은 리스크 관리가 필요한 상태를 표현하고 싶었습니다.
잘 이용해주시면 감사하겠습니다.
오픈 소스 스크립트
트레이딩뷰의 진정한 정신에 따라, 이 스크립트의 작성자는 이를 오픈소스로 공개하여 트레이더들이 기능을 검토하고 검증할 수 있도록 했습니다. 작성자에게 찬사를 보냅니다! 이 코드는 무료로 사용할 수 있지만, 코드를 재게시하는 경우 하우스 룰이 적용된다는 점을 기억하세요.
면책사항
해당 정보와 게시물은 금융, 투자, 트레이딩 또는 기타 유형의 조언이나 권장 사항으로 간주되지 않으며, 트레이딩뷰에서 제공하거나 보증하는 것이 아닙니다. 자세한 내용은 이용 약관을 참조하세요.
오픈 소스 스크립트
트레이딩뷰의 진정한 정신에 따라, 이 스크립트의 작성자는 이를 오픈소스로 공개하여 트레이더들이 기능을 검토하고 검증할 수 있도록 했습니다. 작성자에게 찬사를 보냅니다! 이 코드는 무료로 사용할 수 있지만, 코드를 재게시하는 경우 하우스 룰이 적용된다는 점을 기억하세요.
면책사항
해당 정보와 게시물은 금융, 투자, 트레이딩 또는 기타 유형의 조언이나 권장 사항으로 간주되지 않으며, 트레이딩뷰에서 제공하거나 보증하는 것이 아닙니다. 자세한 내용은 이용 약관을 참조하세요.