OPEN-SOURCE SCRIPT
업데이트됨 Intra-Candles

*For use with <=24 hour Hollow Candles *
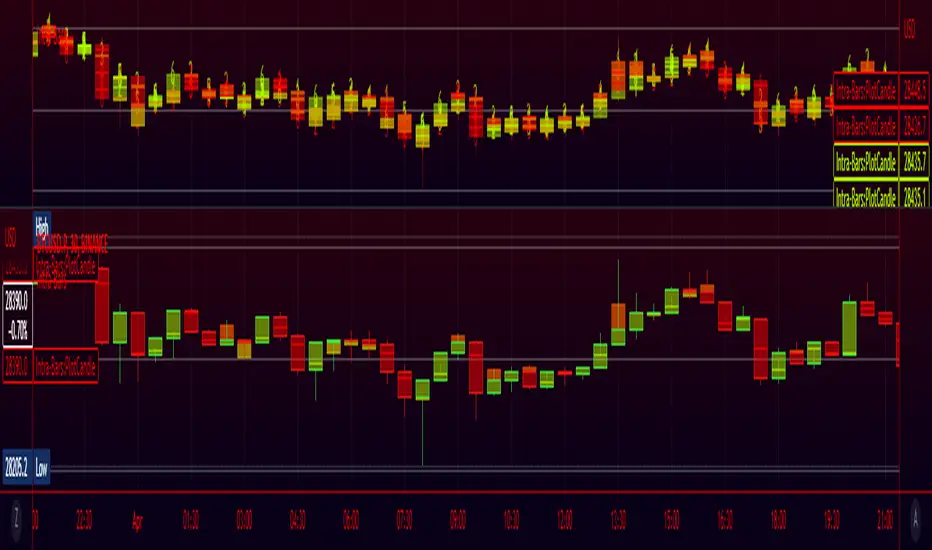
Indicator for more informative candle plotting. Select from 2-6 lower timeframe candles and view the price action of the lower bars within the normal chart's candles. Plotting short time frame candles with a semi-transparent body lets you see reversals that occurred during the larger candle's formation. Use the information provided to inform your own trading decisions.
Indicator for more informative candle plotting. Select from 2-6 lower timeframe candles and view the price action of the lower bars within the normal chart's candles. Plotting short time frame candles with a semi-transparent body lets you see reversals that occurred during the larger candle's formation. Use the information provided to inform your own trading decisions.
릴리즈 노트
Lower timeframe is selected according to the current timeframe.multiplier value divided by the "# of Lower Timeframe Candles" selected in settings. Check if array size is large enough then get the closing value using array.get for each value inside of the IntraBar array.
The first Intra Bar is plotted with the same opening value as the higher timeframe candle and the first value from the array
is used as it's close which also marks the beginning of a new Intra-Bar with the next value in the array, continue this
process for each Intra-bar value inside of the array.
릴리즈 노트
Updated plotcandle(o,h,l,c) values to use high and low values aswell 릴리즈 노트
Fixed timeframe auto selection method to more intelligently select between minutes, hours, days, weeks and months.오픈 소스 스크립트
트레이딩뷰의 진정한 정신에 따라, 이 스크립트의 작성자는 이를 오픈소스로 공개하여 트레이더들이 기능을 검토하고 검증할 수 있도록 했습니다. 작성자에게 찬사를 보냅니다! 이 코드는 무료로 사용할 수 있지만, 코드를 재게시하는 경우 하우스 룰이 적용된다는 점을 기억하세요.
면책사항
해당 정보와 게시물은 금융, 투자, 트레이딩 또는 기타 유형의 조언이나 권장 사항으로 간주되지 않으며, 트레이딩뷰에서 제공하거나 보증하는 것이 아닙니다. 자세한 내용은 이용 약관을 참조하세요.
오픈 소스 스크립트
트레이딩뷰의 진정한 정신에 따라, 이 스크립트의 작성자는 이를 오픈소스로 공개하여 트레이더들이 기능을 검토하고 검증할 수 있도록 했습니다. 작성자에게 찬사를 보냅니다! 이 코드는 무료로 사용할 수 있지만, 코드를 재게시하는 경우 하우스 룰이 적용된다는 점을 기억하세요.
면책사항
해당 정보와 게시물은 금융, 투자, 트레이딩 또는 기타 유형의 조언이나 권장 사항으로 간주되지 않으며, 트레이딩뷰에서 제공하거나 보증하는 것이 아닙니다. 자세한 내용은 이용 약관을 참조하세요.