OPEN-SOURCE SCRIPT
업데이트됨 YCGH Drawdown Percentiles
What This Indicator Does?
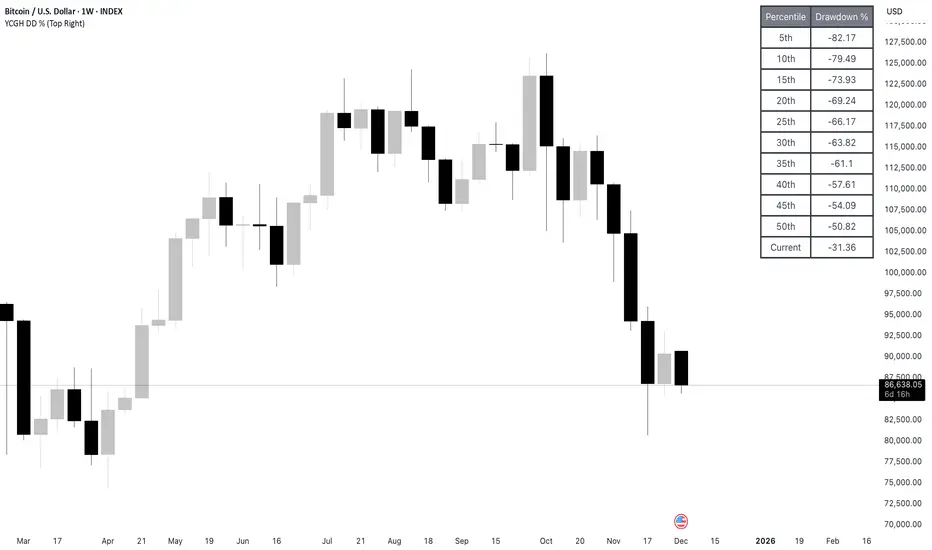
The Drawdown Percentiles indicator tracks how far below the all-time high (ATH) a stock or asset is currently trading, then displays statistical percentiles of historical drawdowns in a customizable table.
Percentile Analysis: It collects up to 5,000 historical bars of drawdown data, sorts them, and calculates user-selected percentiles (default: 10th, 30th, 50th) to show where current drawdowns rank historically.
Visual Display: A table shows each percentile threshold with color-coded drawdown values, helping you quickly assess whether the current drawdown is typical or extreme compared to historical patterns.
Practical Use Cases
Risk Assessment: Identify if current drawdowns fall within normal ranges or represent extreme conditions requiring position adjustments.
Entry/Exit Timing: Use percentile rankings to time entries during historically shallow drawdowns (better conditions) and reduce exposure during deep drawdowns.
Strategy Comparison: Compare drawdown patterns across different assets or trading strategies to evaluate risk-adjusted performance.
릴리즈 노트
updated table릴리즈 노트
logic updated릴리즈 노트
updated Table릴리즈 노트
removed lines릴리즈 노트
table made fancy릴리즈 노트
Summary of Functional Changes:Fixed 10 percentiles instead of 3 customizable ones
Complete percentile calculation logic that actually works
Full table border on all sides (frame)
Individual color customization for each percentile level
Current drawdown display as the last row
Visual ATH reference on the chart
Proper data storage in array for historical analysis
오픈 소스 스크립트
트레이딩뷰의 진정한 정신에 따라, 이 스크립트의 작성자는 이를 오픈소스로 공개하여 트레이더들이 기능을 검토하고 검증할 수 있도록 했습니다. 작성자에게 찬사를 보냅니다! 이 코드는 무료로 사용할 수 있지만, 코드를 재게시하는 경우 하우스 룰이 적용된다는 점을 기억하세요.
YCGH Capital
면책사항
해당 정보와 게시물은 금융, 투자, 트레이딩 또는 기타 유형의 조언이나 권장 사항으로 간주되지 않으며, 트레이딩뷰에서 제공하거나 보증하는 것이 아닙니다. 자세한 내용은 이용 약관을 참조하세요.
오픈 소스 스크립트
트레이딩뷰의 진정한 정신에 따라, 이 스크립트의 작성자는 이를 오픈소스로 공개하여 트레이더들이 기능을 검토하고 검증할 수 있도록 했습니다. 작성자에게 찬사를 보냅니다! 이 코드는 무료로 사용할 수 있지만, 코드를 재게시하는 경우 하우스 룰이 적용된다는 점을 기억하세요.
YCGH Capital
면책사항
해당 정보와 게시물은 금융, 투자, 트레이딩 또는 기타 유형의 조언이나 권장 사항으로 간주되지 않으며, 트레이딩뷰에서 제공하거나 보증하는 것이 아닙니다. 자세한 내용은 이용 약관을 참조하세요.