PROTECTED SOURCE SCRIPT
업데이트됨 Previous Day & Premarket High/Low
# Previous Day & Premarket High/Low Indicator
## Overview
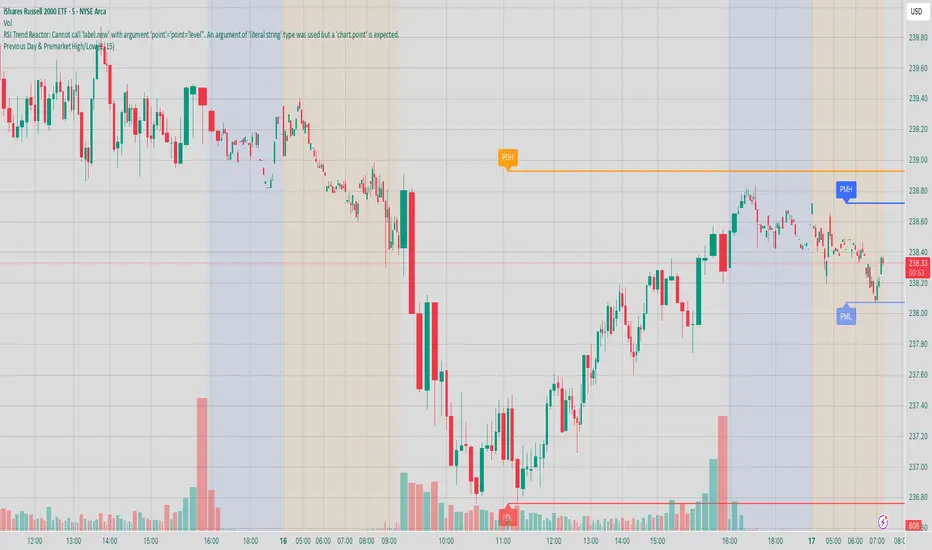
This TradingView Pine Script indicator displays previous day's high/low levels and premarket high/low levels (HOD/LOD) directly on your chart. It helps traders identify key support and resistance levels from the previous trading day and track premarket price action.
## Features
### 📊 Previous Day Levels
- **Previous Day High (PDH)**: Shows the highest price from the previous trading day
- **Previous Day Low (PDL)**: Shows the lowest price from the previous trading day
- **Dynamic lines**: Automatically update each day with new previous day levels
- **Customizable colors**: Green for high, red for low (configurable)
### 🌅 Premarket Levels
- **Live Premarket HOD/LOD**: Real-time tracking of premarket high and low during premarket hours (4:00 AM - 9:30 AM)
- **Static Premarket Levels**: Frozen levels captured at 9:29 AM that persist throughout the trading day
- **Automatic session detection**: Identifies premarket vs regular trading hours
- **Time-based extension**: Lines extend to 4:00 PM end of trading day
## Time Sessions
### Premarket Session
- **Time**: 4:00 AM - 9:30 AM ET
- **Live tracking**: HOD/LOD update in real-time during premarket
- **Capture time**: Final values captured at 9:29 AM for static display
### Regular Trading Session
- **Time**: 9:30 AM - 4:00 PM ET
- **Static display**: Shows frozen premarket levels from 9:29 AM
- **Previous day levels**: Displays levels from the prior trading day
## Visual Elements
### Line Types
1. **Previous Day High**: Solid green line (customizable color)
2. **Previous Day Low**: Solid red line (customizable color)
3. **Live Premarket HOD**: Solid blue line (updates during premarket only)
4. **Live Premarket LOD**: Solid orange line (updates during premarket only)
5. **Static Premarket HOD**: Dashed blue line (frozen at 9:29 AM)
6. **Static Premarket LOD**: Dashed orange line (frozen at 9:29 AM)
### Labels
- **PDH/PDL**: Previous day high/low labels on the right side
- **PreMarket HOD/LOD**: Live premarket labels (during premarket hours)
- **Static Pre HOD/LOD**: Static premarket labels (after 9:29 AM)
## Input Settings
### Display Options
- **Show Previous Day High/Low**: Toggle previous day levels on/off
- **Show Premarket High/Low**: Toggle premarket levels on/off
- **Line Width**: Adjust thickness of all lines (1-5)
### Color Customization
- **Previous Day High Color**: Default green
- **Previous Day Low Color**: Default red
- **Premarket High Color**: Default blue
- **Premarket Low Color**: Default orange
## Overview
This TradingView Pine Script indicator displays previous day's high/low levels and premarket high/low levels (HOD/LOD) directly on your chart. It helps traders identify key support and resistance levels from the previous trading day and track premarket price action.
## Features
### 📊 Previous Day Levels
- **Previous Day High (PDH)**: Shows the highest price from the previous trading day
- **Previous Day Low (PDL)**: Shows the lowest price from the previous trading day
- **Dynamic lines**: Automatically update each day with new previous day levels
- **Customizable colors**: Green for high, red for low (configurable)
### 🌅 Premarket Levels
- **Live Premarket HOD/LOD**: Real-time tracking of premarket high and low during premarket hours (4:00 AM - 9:30 AM)
- **Static Premarket Levels**: Frozen levels captured at 9:29 AM that persist throughout the trading day
- **Automatic session detection**: Identifies premarket vs regular trading hours
- **Time-based extension**: Lines extend to 4:00 PM end of trading day
## Time Sessions
### Premarket Session
- **Time**: 4:00 AM - 9:30 AM ET
- **Live tracking**: HOD/LOD update in real-time during premarket
- **Capture time**: Final values captured at 9:29 AM for static display
### Regular Trading Session
- **Time**: 9:30 AM - 4:00 PM ET
- **Static display**: Shows frozen premarket levels from 9:29 AM
- **Previous day levels**: Displays levels from the prior trading day
## Visual Elements
### Line Types
1. **Previous Day High**: Solid green line (customizable color)
2. **Previous Day Low**: Solid red line (customizable color)
3. **Live Premarket HOD**: Solid blue line (updates during premarket only)
4. **Live Premarket LOD**: Solid orange line (updates during premarket only)
5. **Static Premarket HOD**: Dashed blue line (frozen at 9:29 AM)
6. **Static Premarket LOD**: Dashed orange line (frozen at 9:29 AM)
### Labels
- **PDH/PDL**: Previous day high/low labels on the right side
- **PreMarket HOD/LOD**: Live premarket labels (during premarket hours)
- **Static Pre HOD/LOD**: Static premarket labels (after 9:29 AM)
## Input Settings
### Display Options
- **Show Previous Day High/Low**: Toggle previous day levels on/off
- **Show Premarket High/Low**: Toggle premarket levels on/off
- **Line Width**: Adjust thickness of all lines (1-5)
### Color Customization
- **Previous Day High Color**: Default green
- **Previous Day Low Color**: Default red
- **Premarket High Color**: Default blue
- **Premarket Low Color**: Default orange
릴리즈 노트
a릴리즈 노트
Added alert options릴리즈 노트
Fix Previous day HL value.릴리즈 노트
Added opening range option and lines릴리즈 노트
Fixed lines labels릴리즈 노트
Update color릴리즈 노트
Fixed lines showing wrong PDH PDL at premarket보호된 스크립트입니다
이 스크립트는 비공개 소스로 게시됩니다. 하지만 이를 자유롭게 제한 없이 사용할 수 있습니다 – 자세한 내용은 여기에서 확인하세요.
면책사항
해당 정보와 게시물은 금융, 투자, 트레이딩 또는 기타 유형의 조언이나 권장 사항으로 간주되지 않으며, 트레이딩뷰에서 제공하거나 보증하는 것이 아닙니다. 자세한 내용은 이용 약관을 참조하세요.
면책사항
해당 정보와 게시물은 금융, 투자, 트레이딩 또는 기타 유형의 조언이나 권장 사항으로 간주되지 않으며, 트레이딩뷰에서 제공하거나 보증하는 것이 아닙니다. 자세한 내용은 이용 약관을 참조하세요.