INVITE-ONLY SCRIPT
KPV by Killpips
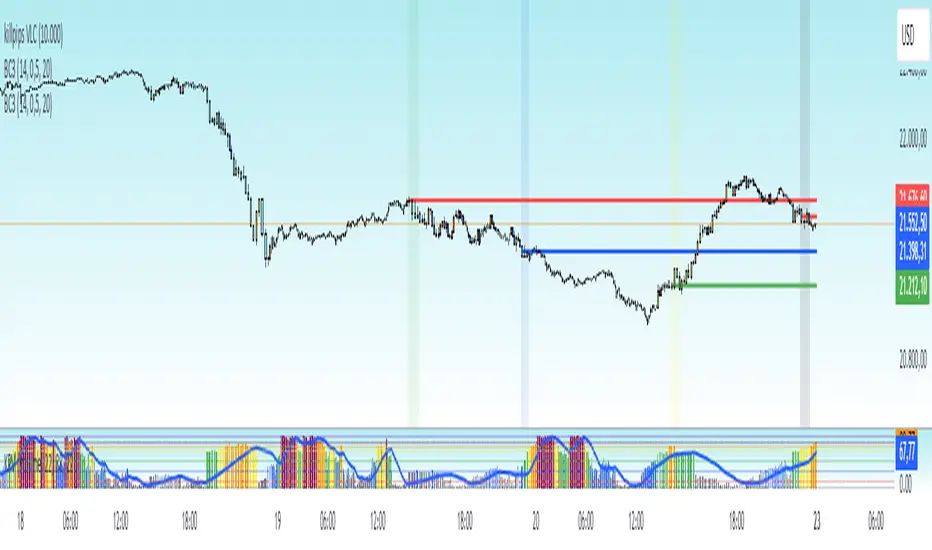
This Pine Script code is an indicator for the TradingView platform that calculates and plots volume percentiles over different time frames (daily, weekly, and monthly). It includes a volume percentile histogram.
Main Code Logic:
Historical Volatility (hvv):
The fHV function is called to calculate the volatility for the logarithmic volume values.
Volume Percentile (hvvp):
The fHVP function calculates the volume percentile based on the calculated historical volatility (hvv).
Percentile Ranks:
prv: The percentile rank of the volume percentile (hvvp) over the last avg periods (to represent the average volume percentile).
prv_1week: The percentile rank of the volume percentile over the last 5 times the avg period (to represent the weekly volume percentile, assuming 5 trading days in a week).
prv_1month: The percentile rank of the volume percentile over the last 22 times the avg period (to represent the monthly volume percentile, assuming 22 trading days in a month).
Volume Percentile Histogram (VV):
The VV variable represents the current value of the volume percentile (hvvp), which is plotted as a histogram. The color of the bars changes depending on the value of VV:
Maroon if above 90
Orange if between 80 and 90
Yellow if between 71 and 79
Green if between 50 and 70
Blu if between 49 and 31
Gray if below 30
초대 전용 스크립트
이 스크립트는 작성자가 승인한 사용자만 접근할 수 있습니다. 사용하려면 요청 후 승인을 받아야 하며, 일반적으로 결제 후에 허가가 부여됩니다. 자세한 내용은 아래 작성자의 안내를 따르거나 killpips에게 직접 문의하세요.
이 비공개 초대 전용 스크립트는 스크립트 모더레이터의 검토를 거치지 않았으며, 하우스 룰 준수 여부는 확인되지 않았습니다. 트레이딩뷰는 스크립트의 작동 방식을 충분히 이해하고 작성자를 완전히 신뢰하지 않는 이상, 해당 스크립트에 비용을 지불하거나 사용하는 것을 권장하지 않습니다. 커뮤니티 스크립트에서 무료 오픈소스 대안을 찾아보실 수도 있습니다.
작성자 지시 사항
Main Code Logic:
Historical Volatility (hvv):
The fHV function is called to calculate the volatility for the logarithmic volume values.
Volume Percentile (hvvp):
The fHVP function calculates the volume percentile based on the calculated historical vola
“A winner is just a man who never gave up.”
면책사항
해당 정보와 게시물은 금융, 투자, 트레이딩 또는 기타 유형의 조언이나 권장 사항으로 간주되지 않으며, 트레이딩뷰에서 제공하거나 보증하는 것이 아닙니다. 자세한 내용은 이용 약관을 참조하세요.