OPEN-SOURCE SCRIPT
Expectation Breakers [QuantVue]
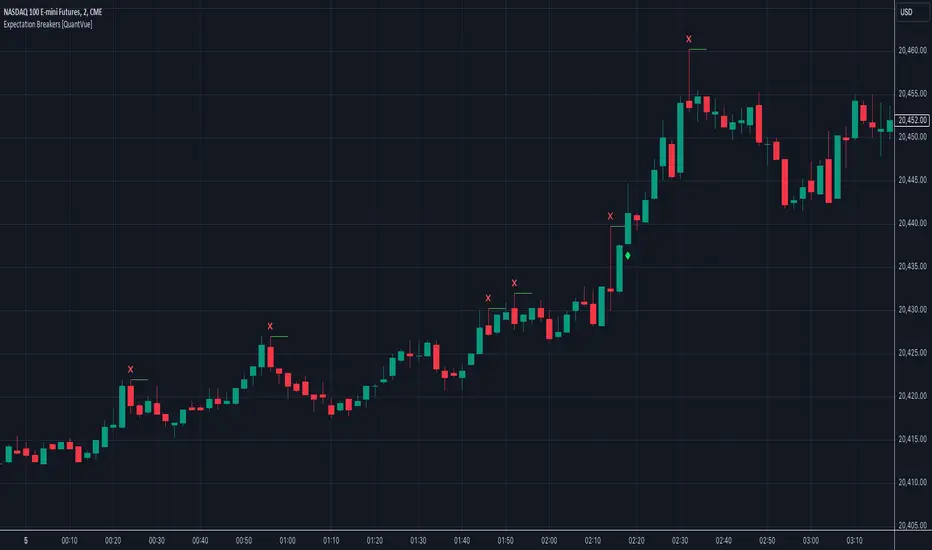
In technical analysis, an "Expectation Breaker" refers to a market event where price action defies typical patterns and anticipated movements, signaling potential shifts in market sentiment and direction.
This indicator looks to take advantage of these opportunities by identifying 2 types of Expectation Breakers: Downside Reversal Buybacks and Upside Reversal Sellbacks.
Downside Reversal
A downside reversals occur when a stock reaches a new high for the user defined lookback period (65 bars by default), and then experiences a larger-than-average drop and closes near its lows. This usually indicates that the market has overextended itself. The expectation is that there will be 2-3 bars of significant selling, following the downside reversal.

However, a notable sign of strength is if the stock rebounds and closes above the downside reversal bar's high within 1-3 bars. This is known as a Downside Reversal Buyback. A rapid recovery following a downside reversal is a powerful bullish indicator, breaking the expectation of lower prices. The quicker price recovers from a downside reversal, the more meaningful it is. Such a swift rebound suggests that the market's strength was underestimated, as downside reversals typically signal a short-term decline.

Upside Reversal
An upside reversal occurs when a stock reaches a new low for the user-defined lookback period (65 bars by default), and then experiences a larger-than-average rise and closes near its highs. This usually indicates that the market has overextended itself to the downside. The expectation is that there will be 2-3 bars of significant buying, following the upside reversal.

However, a notable sign of weakness is if the stock falls back and closes below the upside reversal bar's low within 1-3 bars. This is known as a Upside Reversal Sellback. A rapid fallback following an upside reversal is a powerful bearish indicator, breaking the expectation of higher prices. The quicker price falls back from an upside reversal, the more meaningful it is. Such a swift fallback suggests that the market's weakness was underestimated, as upside reversals typically signal a short-term rally.

The Expectation Breakers indicator identifies these opportunities by first identifying new highs and lows within a defined lookback period. It then compares the true range (TR), average true range (ATR), and closing range to confirm the significance of these reversals. The use of TR and ATR ensures that the reversals are substantial enough to indicate a genuine shift in market sentiment, helping to identify when price action breaks expectations.
Give this indicator a BOOST and COMMENT your thoughts below!
We hope you enjoy.
Cheers!
This indicator looks to take advantage of these opportunities by identifying 2 types of Expectation Breakers: Downside Reversal Buybacks and Upside Reversal Sellbacks.
Downside Reversal
A downside reversals occur when a stock reaches a new high for the user defined lookback period (65 bars by default), and then experiences a larger-than-average drop and closes near its lows. This usually indicates that the market has overextended itself. The expectation is that there will be 2-3 bars of significant selling, following the downside reversal.
However, a notable sign of strength is if the stock rebounds and closes above the downside reversal bar's high within 1-3 bars. This is known as a Downside Reversal Buyback. A rapid recovery following a downside reversal is a powerful bullish indicator, breaking the expectation of lower prices. The quicker price recovers from a downside reversal, the more meaningful it is. Such a swift rebound suggests that the market's strength was underestimated, as downside reversals typically signal a short-term decline.
Upside Reversal
An upside reversal occurs when a stock reaches a new low for the user-defined lookback period (65 bars by default), and then experiences a larger-than-average rise and closes near its highs. This usually indicates that the market has overextended itself to the downside. The expectation is that there will be 2-3 bars of significant buying, following the upside reversal.
However, a notable sign of weakness is if the stock falls back and closes below the upside reversal bar's low within 1-3 bars. This is known as a Upside Reversal Sellback. A rapid fallback following an upside reversal is a powerful bearish indicator, breaking the expectation of higher prices. The quicker price falls back from an upside reversal, the more meaningful it is. Such a swift fallback suggests that the market's weakness was underestimated, as upside reversals typically signal a short-term rally.
The Expectation Breakers indicator identifies these opportunities by first identifying new highs and lows within a defined lookback period. It then compares the true range (TR), average true range (ATR), and closing range to confirm the significance of these reversals. The use of TR and ATR ensures that the reversals are substantial enough to indicate a genuine shift in market sentiment, helping to identify when price action breaks expectations.
Give this indicator a BOOST and COMMENT your thoughts below!
We hope you enjoy.
Cheers!
오픈 소스 스크립트
트레이딩뷰의 진정한 정신에 따라, 이 스크립트의 작성자는 이를 오픈소스로 공개하여 트레이더들이 기능을 검토하고 검증할 수 있도록 했습니다. 작성자에게 찬사를 보냅니다! 이 코드는 무료로 사용할 수 있지만, 코드를 재게시하는 경우 하우스 룰이 적용된다는 점을 기억하세요.
Get Access to the exclusive QuantVue indicators: quantvue.io/
Join thousands of traders in our Free Discord: discord.gg/tC7u7magU3
Join thousands of traders in our Free Discord: discord.gg/tC7u7magU3
면책사항
해당 정보와 게시물은 금융, 투자, 트레이딩 또는 기타 유형의 조언이나 권장 사항으로 간주되지 않으며, 트레이딩뷰에서 제공하거나 보증하는 것이 아닙니다. 자세한 내용은 이용 약관을 참조하세요.