OPEN-SOURCE SCRIPT
20 Day Range High/Low (Turtle Soup)

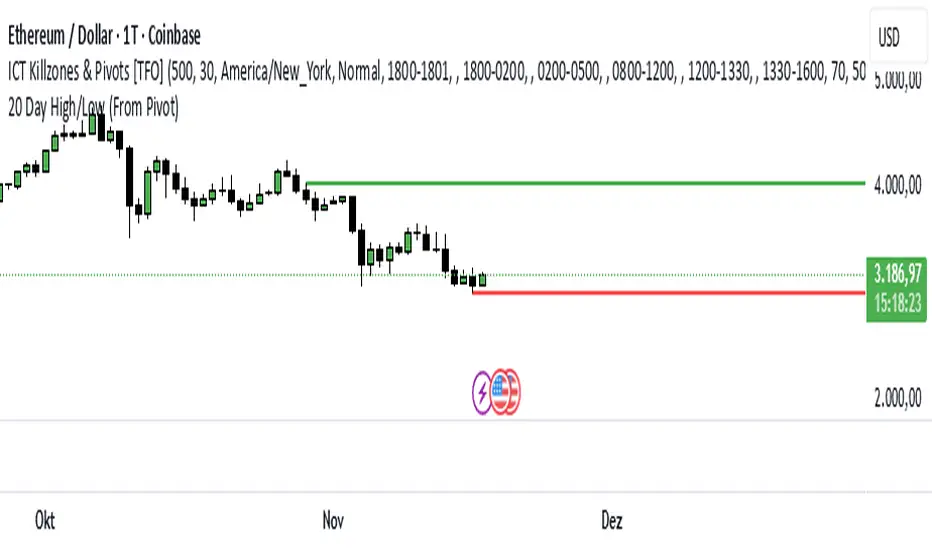
This indicator identifies the Highest High and Lowest Low of the last 20 periods (customizable) and projects horizontal support/resistance lines to the right.
Unlike standard Donchian Channels or other High/Low indicators that clutter the chart with historical "steps" or extend lines infinitely to the left, this script focuses on chart cleanliness.
Key Features:
Pivot-Point Start: The lines do not span the whole chart. They start exactly at the candle where the High or Low occurred.
Right Extension: Lines extend only to the future, providing a clear visual for potential breakouts or support levels.
No Historical Clutter: It does not draw the past movement of the High/Low, keeping your chart clean for price action analysis.
Dynamic: As new Highs or Lows are made, the lines instantly update to the new positions.
How to Use:
Trend Identification: Use the High line as a resistance/breakout level (similar to Turtle Trading strategies).
Stop Loss Placement: The Low line of the last 20 days often acts as a trailing stop location for long-term trends.
Timeframes: While designed for the classic "20-Day" lookback on the Daily chart, this script works on any timeframe (e.g., finding the 20-hour range on a 1H chart).
Settings:
Length: Default is 20 bars. You can change this in the settings to any lookback period you prefer (e.g., 50, 100).
오픈 소스 스크립트
트레이딩뷰의 진정한 정신에 따라, 이 스크립트의 작성자는 이를 오픈소스로 공개하여 트레이더들이 기능을 검토하고 검증할 수 있도록 했습니다. 작성자에게 찬사를 보냅니다! 이 코드는 무료로 사용할 수 있지만, 코드를 재게시하는 경우 하우스 룰이 적용된다는 점을 기억하세요.
면책사항
해당 정보와 게시물은 금융, 투자, 트레이딩 또는 기타 유형의 조언이나 권장 사항으로 간주되지 않으며, 트레이딩뷰에서 제공하거나 보증하는 것이 아닙니다. 자세한 내용은 이용 약관을 참조하세요.
오픈 소스 스크립트
트레이딩뷰의 진정한 정신에 따라, 이 스크립트의 작성자는 이를 오픈소스로 공개하여 트레이더들이 기능을 검토하고 검증할 수 있도록 했습니다. 작성자에게 찬사를 보냅니다! 이 코드는 무료로 사용할 수 있지만, 코드를 재게시하는 경우 하우스 룰이 적용된다는 점을 기억하세요.
면책사항
해당 정보와 게시물은 금융, 투자, 트레이딩 또는 기타 유형의 조언이나 권장 사항으로 간주되지 않으며, 트레이딩뷰에서 제공하거나 보증하는 것이 아닙니다. 자세한 내용은 이용 약관을 참조하세요.