OPEN-SOURCE SCRIPT
Market Structure
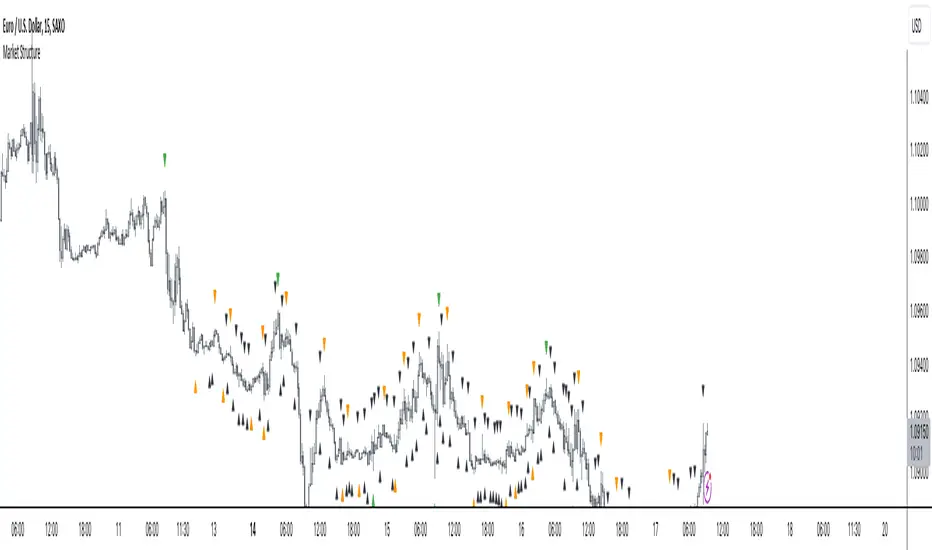
- Intermediate Term Low (ITL): A point on a price chart where the price reaches a relatively lower level compared to the surrounding price points within an intermediate time frame.
- Intermediate Term High (ITH): A point on a price chart where the price reaches a relatively higher level compared to the surrounding price points within an intermediate time frame.
- Long Term Low (LTL): An Intermediate Term Low (ITL) that has higher Intermediate Term Lows (ITL) on both sides of it, indicating a potential significant reversal point and considered a long term trend change.
- Long Term High (LTH): An Intermediate Term High (ITH) that has lower Intermediate Term Highs (ITH) on both sides of it, indicating a potential significant reversal point and considered a long term trend change
The script designed to automatically identify these patterns on a price chart. It categorizes ITH/L and LTH/L points for easy recognition of the market structure and potential pivot points. Traders and analysts often use such patterns and pivot points to make decisions about entering or exiting positions in the market.
Please note that while these concepts are based on certain patterns observed in historical price data, trading and investing in financial markets can be complex and risky. It's important to have a solid understanding of technical analysis, risk management, and market dynamics before making trading decisions.
오픈 소스 스크립트
트레이딩뷰의 진정한 정신에 따라, 이 스크립트의 작성자는 이를 오픈소스로 공개하여 트레이더들이 기능을 검토하고 검증할 수 있도록 했습니다. 작성자에게 찬사를 보냅니다! 이 코드는 무료로 사용할 수 있지만, 코드를 재게시하는 경우 하우스 룰이 적용된다는 점을 기억하세요.
면책사항
해당 정보와 게시물은 금융, 투자, 트레이딩 또는 기타 유형의 조언이나 권장 사항으로 간주되지 않으며, 트레이딩뷰에서 제공하거나 보증하는 것이 아닙니다. 자세한 내용은 이용 약관을 참조하세요.
오픈 소스 스크립트
트레이딩뷰의 진정한 정신에 따라, 이 스크립트의 작성자는 이를 오픈소스로 공개하여 트레이더들이 기능을 검토하고 검증할 수 있도록 했습니다. 작성자에게 찬사를 보냅니다! 이 코드는 무료로 사용할 수 있지만, 코드를 재게시하는 경우 하우스 룰이 적용된다는 점을 기억하세요.
면책사항
해당 정보와 게시물은 금융, 투자, 트레이딩 또는 기타 유형의 조언이나 권장 사항으로 간주되지 않으며, 트레이딩뷰에서 제공하거나 보증하는 것이 아닙니다. 자세한 내용은 이용 약관을 참조하세요.