OPEN-SOURCE SCRIPT
업데이트됨 Open Lines (Daily/W/M/Q/Yearly)
Overview
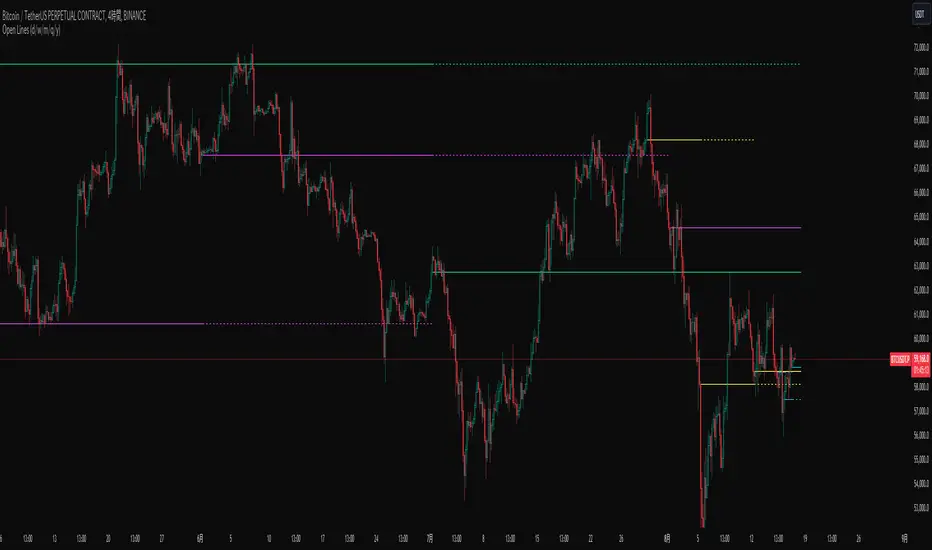
This script draws horizontal lines based on the opening prices of daily, weekly, monthly, quarterly, and yearly candles. A unique feature of this script is the ability to overlay lines from previous periods onto the current period. For example, it can draw the opening price line of the current month as well as the line from the previous month. This allows you to observe not only the battle between bullish and bearish candles of the current period but also the battle over whether the current candle engulfs the previous candle.
Settings
1. Common Settings for Daily to Yearly
Typically, an Extend value of 1 is sufficient, but you can increase this value if you want to observe engulfing patterns spanning multiple periods.
2. Style Settings
To differentiate between the current and past lines, the following settings are available:
Available styles are as follows:
3. Other Settings
This script draws horizontal lines based on the opening prices of daily, weekly, monthly, quarterly, and yearly candles. A unique feature of this script is the ability to overlay lines from previous periods onto the current period. For example, it can draw the opening price line of the current month as well as the line from the previous month. This allows you to observe not only the battle between bullish and bearish candles of the current period but also the battle over whether the current candle engulfs the previous candle.
Settings
1. Common Settings for Daily to Yearly
- On: Toggles the line drawing ON/OFF.
- Line: Sets how many periods back the line should be drawn from the current period.
- Extend: Sets how many periods into the future the lines from past candles should be extended.
Typically, an Extend value of 1 is sufficient, but you can increase this value if you want to observe engulfing patterns spanning multiple periods.
2. Style Settings
To differentiate between the current and past lines, the following settings are available:
- Current session line style: Sets the style for the line representing the opening price of the current candle.
- Next session line style: Sets the style for the line representing the opening price of past candles.
Available styles are as follows:
- sol: solid line
- dsh: dashed line
- dot: dotted line
3. Other Settings
- Allow overlapping of different session lines: By default, this setting prevents overlapping lines when candles from different periods open at the same time. Enabling this option allows lines from different periods, such as quarterly and monthly, to be drawn simultaneously if they overlap. By default, only the lines from the higher time frame are drawn.
릴리즈 노트
Two new features have been added to enhance functionality:1. Session-based Line Drawing:
- You can now draw lines based on the opening price of any specified intraday session.
2. Labels:
- Labels are now drawn at each opening price.
- These labels are aligned to the right side of the screen.
릴리즈 노트
Adjusting input properties오픈 소스 스크립트
트레이딩뷰의 진정한 정신에 따라, 이 스크립트의 작성자는 이를 오픈소스로 공개하여 트레이더들이 기능을 검토하고 검증할 수 있도록 했습니다. 작성자에게 찬사를 보냅니다! 이 코드는 무료로 사용할 수 있지만, 코드를 재게시하는 경우 하우스 룰이 적용된다는 점을 기억하세요.
면책사항
해당 정보와 게시물은 금융, 투자, 트레이딩 또는 기타 유형의 조언이나 권장 사항으로 간주되지 않으며, 트레이딩뷰에서 제공하거나 보증하는 것이 아닙니다. 자세한 내용은 이용 약관을 참조하세요.
오픈 소스 스크립트
트레이딩뷰의 진정한 정신에 따라, 이 스크립트의 작성자는 이를 오픈소스로 공개하여 트레이더들이 기능을 검토하고 검증할 수 있도록 했습니다. 작성자에게 찬사를 보냅니다! 이 코드는 무료로 사용할 수 있지만, 코드를 재게시하는 경우 하우스 룰이 적용된다는 점을 기억하세요.
면책사항
해당 정보와 게시물은 금융, 투자, 트레이딩 또는 기타 유형의 조언이나 권장 사항으로 간주되지 않으며, 트레이딩뷰에서 제공하거나 보증하는 것이 아닙니다. 자세한 내용은 이용 약관을 참조하세요.