OPEN-SOURCE SCRIPT
Swing Levels
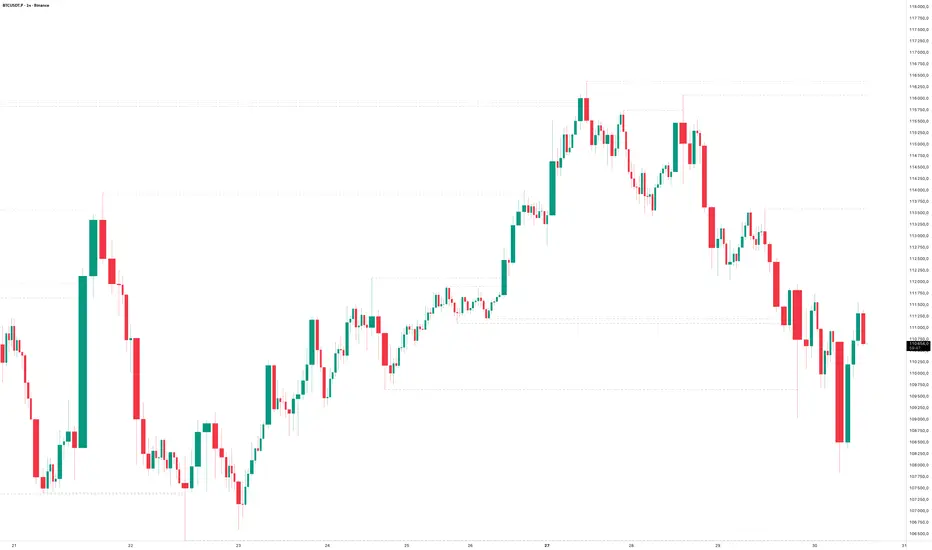
The Swing Levels indicator automatically detects and plots recent swing highs and lows on the chart, turning them into dynamic support and resistance levels.
Each new swing point creates a horizontal line that extends forward in time until price “fills” (touches or breaks) that level. Once a level is filled, it can either disappear or remain visible — depending on your settings.
You can enable alerts to be notified whenever price fills a swing high (breaks resistance) or a swing low (breaks support).
A lookback filter allows limiting how far back in history swing levels are drawn, helping keep the chart clean and efficient.
Main benefits:
• Automatically tracks key market structure turning points
• Helps visualize support and resistance zones in real time
• Optional alerts for breakout confirmations
• Fully customizable colors, line styles, and management behavior
• Works on any timeframe or market
In short:
Swing Levels gives you a clear and automated view of where price has recently reversed — powerful zones where liquidity and reactions often occur again.
Сreated with vibecoding using ChatGPT and Claude.
오픈 소스 스크립트
트레이딩뷰의 진정한 정신에 따라, 이 스크립트의 작성자는 이를 오픈소스로 공개하여 트레이더들이 기능을 검토하고 검증할 수 있도록 했습니다. 작성자에게 찬사를 보냅니다! 이 코드는 무료로 사용할 수 있지만, 코드를 재게시하는 경우 하우스 룰이 적용된다는 점을 기억하세요.
면책사항
해당 정보와 게시물은 금융, 투자, 트레이딩 또는 기타 유형의 조언이나 권장 사항으로 간주되지 않으며, 트레이딩뷰에서 제공하거나 보증하는 것이 아닙니다. 자세한 내용은 이용 약관을 참조하세요.
오픈 소스 스크립트
트레이딩뷰의 진정한 정신에 따라, 이 스크립트의 작성자는 이를 오픈소스로 공개하여 트레이더들이 기능을 검토하고 검증할 수 있도록 했습니다. 작성자에게 찬사를 보냅니다! 이 코드는 무료로 사용할 수 있지만, 코드를 재게시하는 경우 하우스 룰이 적용된다는 점을 기억하세요.
면책사항
해당 정보와 게시물은 금융, 투자, 트레이딩 또는 기타 유형의 조언이나 권장 사항으로 간주되지 않으며, 트레이딩뷰에서 제공하거나 보증하는 것이 아닙니다. 자세한 내용은 이용 약관을 참조하세요.