OPEN-SOURCE SCRIPT
Diamond Grids @shrilss
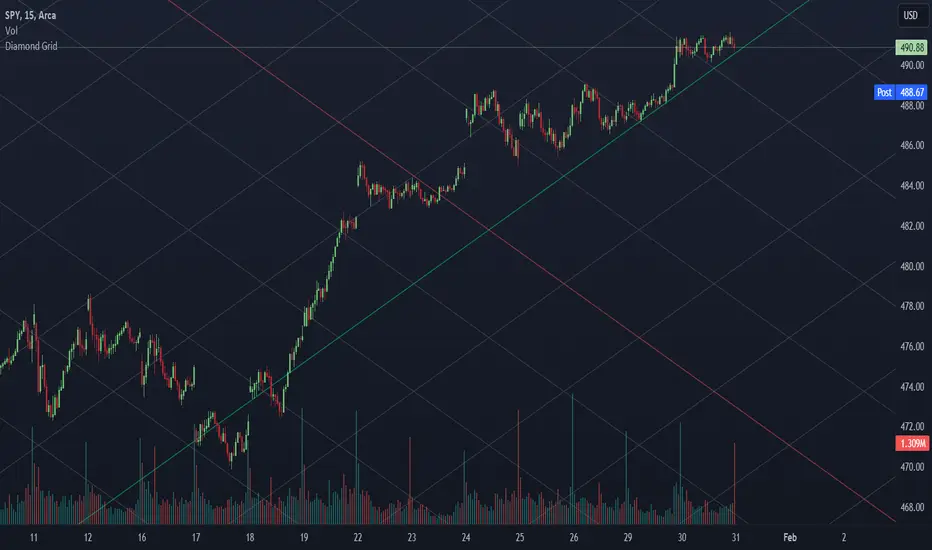
Uncover hidden patterns and potential reversal zones with the Diamond Grids Indicator. This script introduces a unique approach to visualizing price extremes within a specified range, aiding traders in identifying critical support and resistance levels. The indicator dynamically calculates and displays diamond-shaped grids based on user-defined short and long lengths and ATR. Utilize this powerful tool to enhance your technical analysis and gain insights into potential trend reversals.
Key Features:
- Dynamic Grid Calculation: The indicator dynamically calculates and plots diamond-shaped grids based on specified short and long lengths. These grids represent key price extremes within the defined range.
- Multi-Level Support and Resistance: Each diamond grid consists of multiple support and resistance lines, providing a comprehensive view of potential reversal zones. Traders can use these levels to make informed decisions.
- Customizable Parameters: Tailor the indicator to your trading style with customizable parameters such as short length, long length, and a multiplier. Adjust these settings to align the indicator with your unique preferences.
- Real-Time Updates: The indicator updates in real-time, ensuring that traders have the latest information on potential reversal zones. Stay ahead of market movements and make timely decisions.
- Toggle Trend Visualization: Diamond-shaped grids are color-coded for easy interpretation. Positive and negative grid lines are distinctly marked, offering a clear visual representation of the overall trend.
오픈 소스 스크립트
트레이딩뷰의 진정한 정신에 따라, 이 스크립트의 작성자는 이를 오픈소스로 공개하여 트레이더들이 기능을 검토하고 검증할 수 있도록 했습니다. 작성자에게 찬사를 보냅니다! 이 코드는 무료로 사용할 수 있지만, 코드를 재게시하는 경우 하우스 룰이 적용된다는 점을 기억하세요.
면책사항
해당 정보와 게시물은 금융, 투자, 트레이딩 또는 기타 유형의 조언이나 권장 사항으로 간주되지 않으며, 트레이딩뷰에서 제공하거나 보증하는 것이 아닙니다. 자세한 내용은 이용 약관을 참조하세요.
오픈 소스 스크립트
트레이딩뷰의 진정한 정신에 따라, 이 스크립트의 작성자는 이를 오픈소스로 공개하여 트레이더들이 기능을 검토하고 검증할 수 있도록 했습니다. 작성자에게 찬사를 보냅니다! 이 코드는 무료로 사용할 수 있지만, 코드를 재게시하는 경우 하우스 룰이 적용된다는 점을 기억하세요.
면책사항
해당 정보와 게시물은 금융, 투자, 트레이딩 또는 기타 유형의 조언이나 권장 사항으로 간주되지 않으며, 트레이딩뷰에서 제공하거나 보증하는 것이 아닙니다. 자세한 내용은 이용 약관을 참조하세요.