OPEN-SOURCE SCRIPT
MACD M4CD
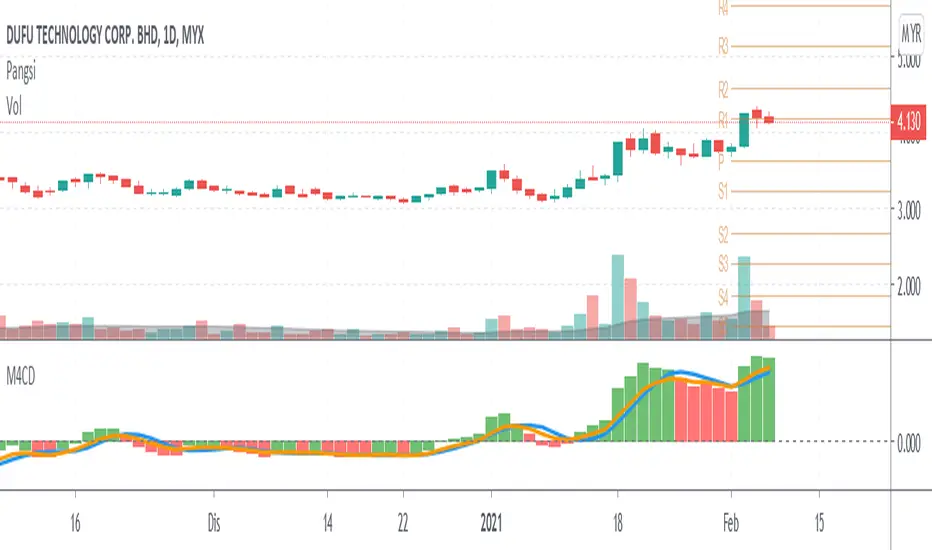
This script show:
1. Signal line base on sma blue color
2. Signal line base on ema orange color
3. Green bar mean current bar is high than signal line
4. Red bar mean current bar is low than signal line
if bar upper zero line, it show uptrend
if bar below zero line, it show downtrend
If orange line cross up blue line, it show signal buy.
If blue line cross down orange line, it show signal sell.
Combined it with other indicator you preferred such as support and resistant to avoid more noise.
The default setting is 5,20,5. (for short to midterm strategy)
my idea:
5 for five days in a week.
20 for twenty day in a month.
Thats all, hope benefit tou you all.
Thank you.
오픈 소스 스크립트
트레이딩뷰의 진정한 정신에 따라, 이 스크립트의 작성자는 이를 오픈소스로 공개하여 트레이더들이 기능을 검토하고 검증할 수 있도록 했습니다. 작성자에게 찬사를 보냅니다! 이 코드는 무료로 사용할 수 있지만, 코드를 재게시하는 경우 하우스 룰이 적용된다는 점을 기억하세요.
면책사항
해당 정보와 게시물은 금융, 투자, 트레이딩 또는 기타 유형의 조언이나 권장 사항으로 간주되지 않으며, 트레이딩뷰에서 제공하거나 보증하는 것이 아닙니다. 자세한 내용은 이용 약관을 참조하세요.
오픈 소스 스크립트
트레이딩뷰의 진정한 정신에 따라, 이 스크립트의 작성자는 이를 오픈소스로 공개하여 트레이더들이 기능을 검토하고 검증할 수 있도록 했습니다. 작성자에게 찬사를 보냅니다! 이 코드는 무료로 사용할 수 있지만, 코드를 재게시하는 경우 하우스 룰이 적용된다는 점을 기억하세요.
면책사항
해당 정보와 게시물은 금융, 투자, 트레이딩 또는 기타 유형의 조언이나 권장 사항으로 간주되지 않으며, 트레이딩뷰에서 제공하거나 보증하는 것이 아닙니다. 자세한 내용은 이용 약관을 참조하세요.