OPEN-SOURCE SCRIPT
Sri Yantra-Scret Geometry - AYNET
Explanation of the Script
Inputs:
periods: Number of bars used for calculating the moving average and standard deviation.
yloc: Chooses the display location (above or below the bars).
Moving Average and Standard Deviation:
ma: Moving average of the close price for the specified period.
std: Standard deviation, used to set the range for the Sri Yantra triangle points.
Triangle Points:
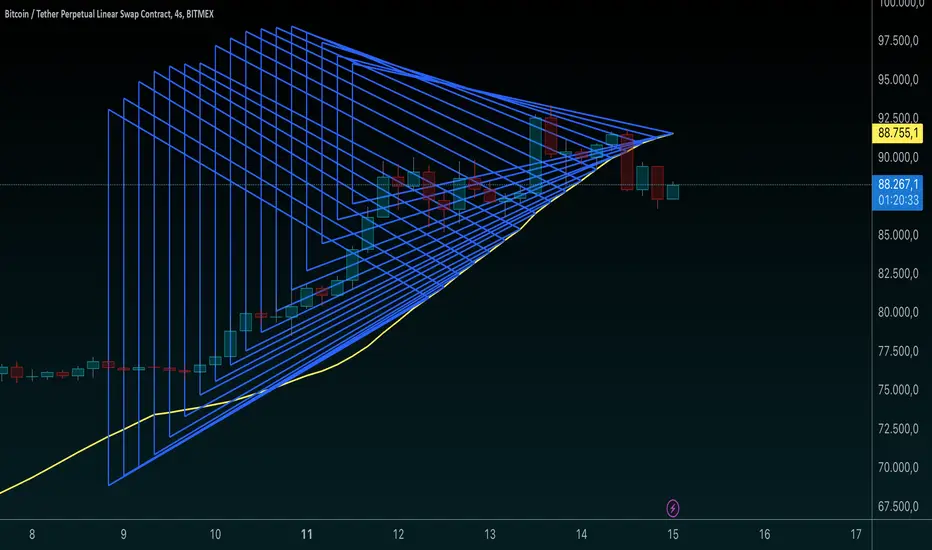
p1, p2, and p3 are the points for constructing the triangle, with p1 and p2 set at two standard deviations above and below the moving average, and p3 at the moving average itself.
Sri Yantra Triangle Drawing:
Three lines form a triangle, with the moving average line serving as the midpoint anchor.
The triangle pattern shifts across bars as new moving average values are calculated.
Moving Average Plot:
The moving average is plotted in red for visual reference against the triangle pattern.
This basic script emulates the Sri Yantra pattern using price data, creating a spiritual and aesthetic overlay on price charts, ideal for users looking to incorporate sacred geometry into their technical analysis.
Inputs:
periods: Number of bars used for calculating the moving average and standard deviation.
yloc: Chooses the display location (above or below the bars).
Moving Average and Standard Deviation:
ma: Moving average of the close price for the specified period.
std: Standard deviation, used to set the range for the Sri Yantra triangle points.
Triangle Points:
p1, p2, and p3 are the points for constructing the triangle, with p1 and p2 set at two standard deviations above and below the moving average, and p3 at the moving average itself.
Sri Yantra Triangle Drawing:
Three lines form a triangle, with the moving average line serving as the midpoint anchor.
The triangle pattern shifts across bars as new moving average values are calculated.
Moving Average Plot:
The moving average is plotted in red for visual reference against the triangle pattern.
This basic script emulates the Sri Yantra pattern using price data, creating a spiritual and aesthetic overlay on price charts, ideal for users looking to incorporate sacred geometry into their technical analysis.
오픈 소스 스크립트
트레이딩뷰의 진정한 정신에 따라, 이 스크립트의 작성자는 이를 오픈소스로 공개하여 트레이더들이 기능을 검토하고 검증할 수 있도록 했습니다. 작성자에게 찬사를 보냅니다! 이 코드는 무료로 사용할 수 있지만, 코드를 재게시하는 경우 하우스 룰이 적용된다는 점을 기억하세요.
면책사항
해당 정보와 게시물은 금융, 투자, 트레이딩 또는 기타 유형의 조언이나 권장 사항으로 간주되지 않으며, 트레이딩뷰에서 제공하거나 보증하는 것이 아닙니다. 자세한 내용은 이용 약관을 참조하세요.
오픈 소스 스크립트
트레이딩뷰의 진정한 정신에 따라, 이 스크립트의 작성자는 이를 오픈소스로 공개하여 트레이더들이 기능을 검토하고 검증할 수 있도록 했습니다. 작성자에게 찬사를 보냅니다! 이 코드는 무료로 사용할 수 있지만, 코드를 재게시하는 경우 하우스 룰이 적용된다는 점을 기억하세요.
면책사항
해당 정보와 게시물은 금융, 투자, 트레이딩 또는 기타 유형의 조언이나 권장 사항으로 간주되지 않으며, 트레이딩뷰에서 제공하거나 보증하는 것이 아닙니다. 자세한 내용은 이용 약관을 참조하세요.