OPEN-SOURCE SCRIPT
Weekday Colors with Time Highlighting by Nabojeet
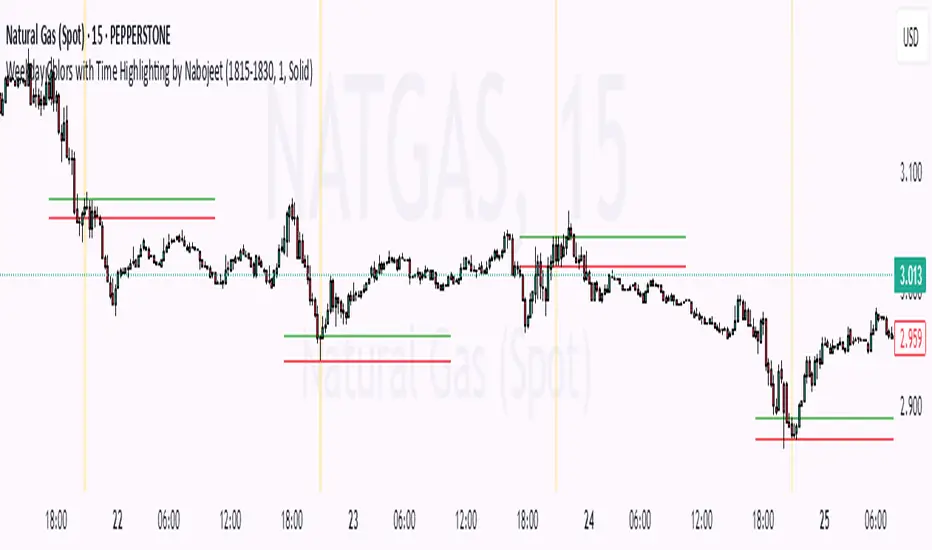
This script is a Pine Script (version 6) indicator called "Weekday Colors with Time Highlighting" designed for TradingView charts. It has several key functions:
1. **Weekday Color Coding**:
- Assigns different background colors to each trading day (Monday through Friday)
- Allows users to customize the color for each day
- Includes toggles to enable/disable colors for specific days
2. **Time Range Highlighting**:
- Highlights a specific time period (e.g., 18:15-18:30) on every trading day
- Uses a custom color that can be adjusted by the user
- The time range is specified in HHMM-HHMM format
3. **High/Low Line Drawing**:
- Automatically identifies the highest high and lowest low points within the specified time range
- Draws horizontal lines at these levels when the time period ends
- Lines extend forward in time to serve as support/resistance references
- Users can customize the line color, width, and style (solid, dotted, or dashed)
The script is organized into logical sections with input parameters grouped by function (Weekday Colors, Weekday Display, Time Highlighting, and Horizontal Lines). Each section's inputs are customizable through the indicator settings panel.
This indicator would be particularly useful for traders who:
- Want visual distinction between different trading days
- Focus on specific time periods each day (like market opens, closes, or specific sessions)
- Use intraday support/resistance levels from key time periods
- Want to quickly identify session highs and lows
The implementation resets tracking variables at the beginning of each new time range and draws the lines once the time period ends, ensuring accurate high/low marking for each day's specified time window.
Author - Nabojeet
오픈 소스 스크립트
트레이딩뷰의 진정한 정신에 따라, 이 스크립트의 작성자는 이를 오픈소스로 공개하여 트레이더들이 기능을 검토하고 검증할 수 있도록 했습니다. 작성자에게 찬사를 보냅니다! 이 코드는 무료로 사용할 수 있지만, 코드를 재게시하는 경우 하우스 룰이 적용된다는 점을 기억하세요.
면책사항
해당 정보와 게시물은 금융, 투자, 트레이딩 또는 기타 유형의 조언이나 권장 사항으로 간주되지 않으며, 트레이딩뷰에서 제공하거나 보증하는 것이 아닙니다. 자세한 내용은 이용 약관을 참조하세요.
오픈 소스 스크립트
트레이딩뷰의 진정한 정신에 따라, 이 스크립트의 작성자는 이를 오픈소스로 공개하여 트레이더들이 기능을 검토하고 검증할 수 있도록 했습니다. 작성자에게 찬사를 보냅니다! 이 코드는 무료로 사용할 수 있지만, 코드를 재게시하는 경우 하우스 룰이 적용된다는 점을 기억하세요.
면책사항
해당 정보와 게시물은 금융, 투자, 트레이딩 또는 기타 유형의 조언이나 권장 사항으로 간주되지 않으며, 트레이딩뷰에서 제공하거나 보증하는 것이 아닙니다. 자세한 내용은 이용 약관을 참조하세요.