PROTECTED SOURCE SCRIPT
YBL – Tick CVD PRO (CVD + Precio Normalizado + Divergencias)
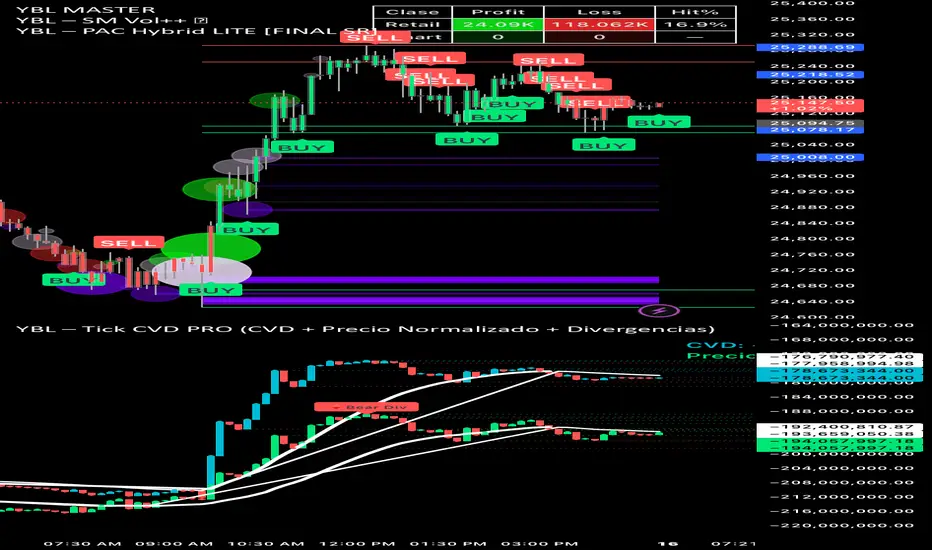
YBL – Tick CVD PRO (CVD + Normalized Price + Divergences)
YBL – Tick CVD PRO is a tick-based Cumulative Volume Delta engine that plots CVD and a normalized price curve in the same panel, making it easy to see when price and aggression are aligned or diverging.
The script focuses on intraday order-flow context, showing where real buying/selling pressure is coming in, where it is fading, and where price is moving without confirmation from CVD.
⸻
Main features
• Tick CVD engine
• Cumulative Volume Delta calculated either as:
• volume × price change (more sensitive), or
• absolute volume by candle color (classic +/– volume).
• Option to accumulate only during a chosen session window (e.g. 09:30–16:00).
• Normalized Price Overlay
• Price is normalized into the same range as CVD over a lookback window, so you can visually compare:
• when price makes new highs/lows with CVD confirmation, and
• when price prints extremes without CVD support (potential traps).
• Two visual modes
• Line mode or candle mode for both CVD and normalized price.
• Aesthetic / Efficient visual presets (different fill transparencies for clearer reading depending on style and performance).
• Adaptive Moving Averages
• Independent MAs for CVD and normalized price:
• WMA, HMA, SMA, EMA, or None.
• Optional:
• Color by MA type.
• Thicker line when the slope is positive, making trend shifts easier to spot at a glance.
• Key levels & dots
• Automatic key levels (pivot highs/lows) for CVD and normalized price, extended to the right.
• Optional dots on CVD and price curves, with the possibility to show numeric values as labels.
• Divergences (HH/LL)
• Automatic bearish divergence:
• Price makes a higher high, but CVD fails to confirm → “🔻Bear Div”.
• Automatic bullish divergence:
• Price makes a lower low, but CVD fails to confirm → “🔺Bull Div”.
• Pivot lengths are fully configurable.
• Session-aware CVD
• Choose an exchange session (e.g. 09:30–16:00) and optionally accumulate CVD only inside that range, resetting behavior for better intraday reading.
• Alerts
• CVD crossing above/below its MA (momentum shift).
• Bullish & bearish divergence signals.
These alerts can be used to build automated conditions in your strategy or to receive notifications.
• Quick header display
• On the last bar, a compact header shows:
• Current CVD value + direction arrow.
• Current normalized price / last close + direction arrow.
⸻
How I personally use it
• Confirm breakouts and trend legs:
• I want price and CVD moving together, with CVD making new extremes in the direction of the move.
• Spot traps and absorption:
• When price makes a new high/low but CVD diverges, I pay attention to potential reversals or exhaustion.
• Filter entries from my main YBL tools:
• I prefer to trade with CVD slope and MA direction, and I am cautious when entries appear against clear CVD pressure.
⸻
⚠️ Disclaimer:
This script is for educational and analytical purposes only and is not financial advice. Always do your own research and manage your risk.
보호된 스크립트입니다
이 스크립트는 비공개 소스로 게시됩니다. 하지만 이를 자유롭게 제한 없이 사용할 수 있습니다 – 자세한 내용은 여기에서 확인하세요.
면책사항
해당 정보와 게시물은 금융, 투자, 트레이딩 또는 기타 유형의 조언이나 권장 사항으로 간주되지 않으며, 트레이딩뷰에서 제공하거나 보증하는 것이 아닙니다. 자세한 내용은 이용 약관을 참조하세요.
보호된 스크립트입니다
이 스크립트는 비공개 소스로 게시됩니다. 하지만 이를 자유롭게 제한 없이 사용할 수 있습니다 – 자세한 내용은 여기에서 확인하세요.
면책사항
해당 정보와 게시물은 금융, 투자, 트레이딩 또는 기타 유형의 조언이나 권장 사항으로 간주되지 않으며, 트레이딩뷰에서 제공하거나 보증하는 것이 아닙니다. 자세한 내용은 이용 약관을 참조하세요.