INVITE-ONLY SCRIPT
업데이트됨 Investor Satisfaction/Price Divergence Pro [Ox_kali]
The "Investor Satisfaction/Price Divergence" is an indicator designed to quantify and juxtapose the satisfaction of a group of investors with potential price divergences of the asset.
The primary goal of this indicator is to provide a reliable tool for gauging investor sentiment and identifying price divergences. These insights can be instrumental in predicting possible market trend reversals.
Key Features
Functionality Analysis:
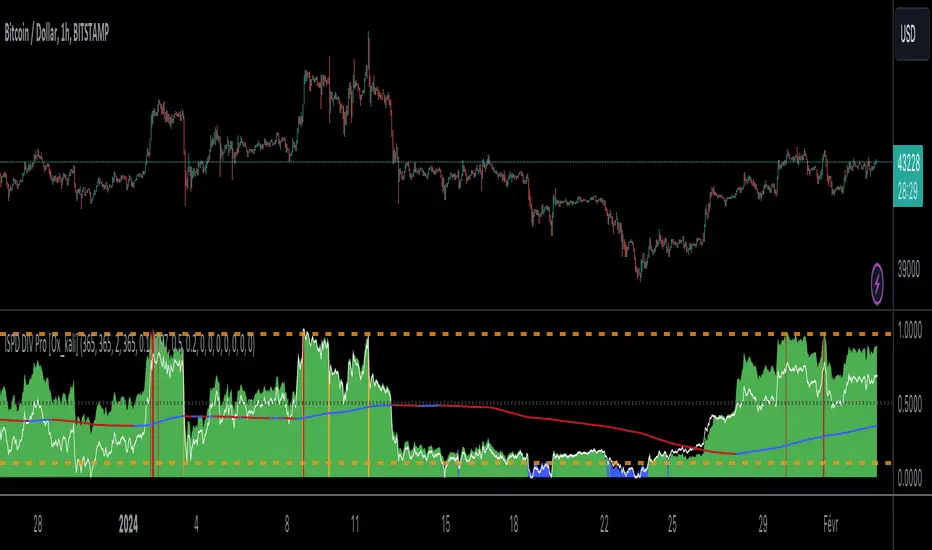
This indicator begins by identifying the highest and lowest prices over a period defined by the user. It then calculates the average investor satisfaction based on the change in the closing price from the investment point to the current price, relative to the range between the highest and lowest prices.
This satisfaction measure is then normalized between 0 and 1, providing a uniform measure of investor sentiment. The indicator also identifies potential price divergence by comparing the normalized satisfaction with the normalized price. This divergence is then plotted as a histogram, with the color of the histogram bars indicating whether the market is oversold, overbought, or in a normal state. Anomalies in satisfaction change are highlighted in yellow, helping traders to spot unusual market behavior.
Trading Application
The "Investor Satisfaction & Price Divergence" indicator can be incorporated into a variety of trading strategies. A significant divergence between normalized satisfaction and the asset price can signal a potential market reversal. Additionally, a sudden drop or rise in investor satisfaction could indicate a sell-off or a buying spree, respectively. Additionally, the capability to spot irregularities in satisfaction change may be useful in recognizing unusual market conditions, possibly providing early indications of noteworthy market events
Please note that the investor Satisfaction/Price Divergence by Ox_kali is provided for educational purposes only and is not meant to constitute financial advice. This indicator is not a guarantee of future market performance and should be used in conjunction with proper risk management. Always ensure that you have a thorough understanding of the indicator’s methodology and its limitations before making any investment decisions. Additionally, past performance is not indicative of future results.
The primary goal of this indicator is to provide a reliable tool for gauging investor sentiment and identifying price divergences. These insights can be instrumental in predicting possible market trend reversals.
Key Features
- Calculation of the highest and lowest prices over a user-defined period.
- Computation of the average satisfaction of investors who have invested over a user-defined period.
- Normalization of average satisfaction between 0 and 1 to provide a standardized measure of investor sentiment.
- Identification of price divergence between the normalized satisfaction and the actual asset price.
- Detection of anomalies in satisfaction change, which can suggest unusual market conditions.
- Plotting histogram display of the difference between normalized satisfaction and price divergence.
Functionality Analysis:
This indicator begins by identifying the highest and lowest prices over a period defined by the user. It then calculates the average investor satisfaction based on the change in the closing price from the investment point to the current price, relative to the range between the highest and lowest prices.
This satisfaction measure is then normalized between 0 and 1, providing a uniform measure of investor sentiment. The indicator also identifies potential price divergence by comparing the normalized satisfaction with the normalized price. This divergence is then plotted as a histogram, with the color of the histogram bars indicating whether the market is oversold, overbought, or in a normal state. Anomalies in satisfaction change are highlighted in yellow, helping traders to spot unusual market behavior.
Trading Application
The "Investor Satisfaction & Price Divergence" indicator can be incorporated into a variety of trading strategies. A significant divergence between normalized satisfaction and the asset price can signal a potential market reversal. Additionally, a sudden drop or rise in investor satisfaction could indicate a sell-off or a buying spree, respectively. Additionally, the capability to spot irregularities in satisfaction change may be useful in recognizing unusual market conditions, possibly providing early indications of noteworthy market events
Please note that the investor Satisfaction/Price Divergence by Ox_kali is provided for educational purposes only and is not meant to constitute financial advice. This indicator is not a guarantee of future market performance and should be used in conjunction with proper risk management. Always ensure that you have a thorough understanding of the indicator’s methodology and its limitations before making any investment decisions. Additionally, past performance is not indicative of future results.
릴리즈 노트
Indicator name update릴리즈 노트
Minor code fix릴리즈 노트
Update Version 2.0 :New Features and Improvements:
- Extension of Analysis Periods: The ranges for the periods of minimum and maximum calculation as well as for average satisfaction have been extended from 365 days to 3000 days, allowing for longer and more detailed analyses.
- Addition of Simple Moving Average (SMA): A new option to calculate and display the SMA of normalized satisfaction over a configurable period offers an additional trend analysis tool.
- Addition of Investors satisfaction line : A new feature that displays normalized investor satisfaction, offering parallel buy or sell signals based on market sentiment analysis..
- Advanced Color Customization: Introduction of parameters allowing users to customize colors for buy and sell level lines, the average line, overbought and oversold areas, as well as anomalies.
- Enhanced Transparency Settings: Detailed transparency options for colored areas and lines enable better adaptation of the indicator to different chart styles and visual preferences.
- New Alerts: Improved alert conditions for blue (buy) and red (sell) areas, as well as for investors white lines, facilitate rapid decision-making based on specific conditions.
Corrections and Optimizations:
- Adjustment of Default Values and Value Ranges: Adjustments of default values and ranges for several input parameters, ensuring better flexibility and precision in analyses.
- Code Optimization: The code has been optimized for better performance and greater efficiency, reducing the load on the trading platform and improving user experience.
- Adjustment of anomaly_threshold value: from 0.15 to 0.2 for enhanced precision.
- Adjustment of sell level line value: from 0.95 to 0.97 for enhanced precision.
초대 전용 스크립트
이 스크립트는 작성자가 승인한 사용자만 접근할 수 있습니다. 사용하려면 요청 후 승인을 받아야 하며, 일반적으로 결제 후에 허가가 부여됩니다. 자세한 내용은 아래 작성자의 안내를 따르거나 Ox_kali에게 직접 문의하세요.
트레이딩뷰는 스크립트의 작동 방식을 충분히 이해하고 작성자를 완전히 신뢰하지 않는 이상, 해당 스크립트에 비용을 지불하거나 사용하는 것을 권장하지 않습니다. 커뮤니티 스크립트에서 무료 오픈소스 대안을 찾아보실 수도 있습니다.
작성자 지시 사항
Send me a private message on TradingView indicating your interest in the script. Please do not use the 'Comments' section to request access to this script.
면책사항
해당 정보와 게시물은 금융, 투자, 트레이딩 또는 기타 유형의 조언이나 권장 사항으로 간주되지 않으며, 트레이딩뷰에서 제공하거나 보증하는 것이 아닙니다. 자세한 내용은 이용 약관을 참조하세요.