OPEN-SOURCE SCRIPT
Dynamic SMA
Timeframe Detection: The indicator first identifies the current timeframe of the chart (e.g., daily, 4-hour, 1-hour).
SMA Calculation: It calculates three different SMAs:
Daily SMA: A 8-period SMA calculated on daily closing prices.
4-Hour SMA: A 50-period SMA calculated on 4-hour closing prices.
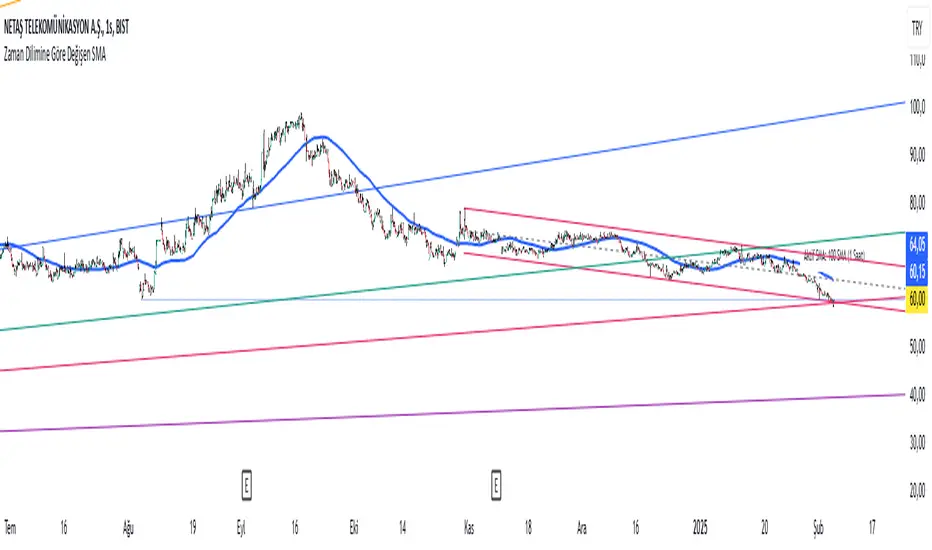
1-Hour SMA: A 100-period SMA calculated on 1-hour closing prices.
Dynamic SMA Selection: Based on the detected timeframe, the indicator selects the appropriate SMA to display:
If the timeframe is daily, it uses the daily SMA.
If the timeframe is 4-hour, it uses the 4-hour SMA.
If the timeframe is 1-hour, it uses the 1-hour SMA.
Plotting: The selected SMA is plotted on the chart as a blue line.
Dynamic Label: The indicator also creates a dynamic label that displays the current SMA being used, along with the corresponding timeframe and period. For example, it will show "Active SMA: 8 SMA (Daily)" when the daily SMA is active.
This indicator is useful for traders who want to use different SMAs for different timeframes without having to manually switch between them. It provides a convenient way to see the relevant SMA for the current chart view.
SMA Calculation: It calculates three different SMAs:
Daily SMA: A 8-period SMA calculated on daily closing prices.
4-Hour SMA: A 50-period SMA calculated on 4-hour closing prices.
1-Hour SMA: A 100-period SMA calculated on 1-hour closing prices.
Dynamic SMA Selection: Based on the detected timeframe, the indicator selects the appropriate SMA to display:
If the timeframe is daily, it uses the daily SMA.
If the timeframe is 4-hour, it uses the 4-hour SMA.
If the timeframe is 1-hour, it uses the 1-hour SMA.
Plotting: The selected SMA is plotted on the chart as a blue line.
Dynamic Label: The indicator also creates a dynamic label that displays the current SMA being used, along with the corresponding timeframe and period. For example, it will show "Active SMA: 8 SMA (Daily)" when the daily SMA is active.
This indicator is useful for traders who want to use different SMAs for different timeframes without having to manually switch between them. It provides a convenient way to see the relevant SMA for the current chart view.
오픈 소스 스크립트
트레이딩뷰의 진정한 정신에 따라, 이 스크립트의 작성자는 이를 오픈소스로 공개하여 트레이더들이 기능을 검토하고 검증할 수 있도록 했습니다. 작성자에게 찬사를 보냅니다! 이 코드는 무료로 사용할 수 있지만, 코드를 재게시하는 경우 하우스 룰이 적용된다는 점을 기억하세요.
면책사항
해당 정보와 게시물은 금융, 투자, 트레이딩 또는 기타 유형의 조언이나 권장 사항으로 간주되지 않으며, 트레이딩뷰에서 제공하거나 보증하는 것이 아닙니다. 자세한 내용은 이용 약관을 참조하세요.
오픈 소스 스크립트
트레이딩뷰의 진정한 정신에 따라, 이 스크립트의 작성자는 이를 오픈소스로 공개하여 트레이더들이 기능을 검토하고 검증할 수 있도록 했습니다. 작성자에게 찬사를 보냅니다! 이 코드는 무료로 사용할 수 있지만, 코드를 재게시하는 경우 하우스 룰이 적용된다는 점을 기억하세요.
면책사항
해당 정보와 게시물은 금융, 투자, 트레이딩 또는 기타 유형의 조언이나 권장 사항으로 간주되지 않으며, 트레이딩뷰에서 제공하거나 보증하는 것이 아닙니다. 자세한 내용은 이용 약관을 참조하세요.