INVITE-ONLY SCRIPT
Boss Oscillator [Crypto Trading FR]
The Boss Oscillator is a momentum indicator using support and resistance levels and refers to the position of the closing price in relationship to the price range over a period of time. It is calculated as the difference between the close and the low, divided by the price range (the difference between the high and low over a certain period of time). Thus, the indicator takes a value between 0,1 and -0,1 and is expressed in percentage points.
A Boss Oscillator value over 0,92% (yellow) indicates that the security is OVERBOUGHT and a crossover below that threshold represents a potential sell signal while a value below -0,92% (red) indicates that the security is OVERSOLD and a crossover above that threshold indicates a potential buy signal.
Optimal conditions for considering a short Entry
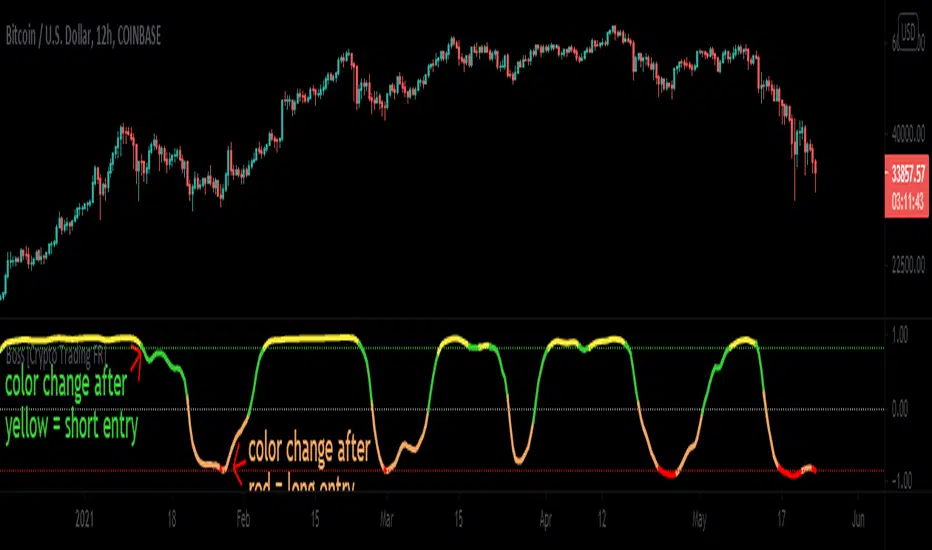
During an uptrend, sell when you get a short signal: the "Boss Oscillator" (yellow overbought line) drops below 0,92% (higher band) and is turning green.
Optimal conditions for considering a long Entry
During a downtrend, buy when you get a long signal: the "Boss Oscillator" (red oversold line) rises above -0,92% (lower band) and is turning orange.
Triggers for scaling/adding into your position = Keeping in mind that this oscillator on its own is not meant to be the sole reason for taking a trade, here are some triggers you will see for getting into position (preferably with the optimal conditions being met) The Oscillator flips from yellow color into a red slide and vise versa. The Oscillator crosses the midline up or down. The Oscillaor begins going up/down and is crossing the midline levels at 0. The Oscillator shift from one color to the next in the favored direction of the trade you wish to make.
Signs for taking profit and protecting your trade = the Boss Oscillator changes colors at the top or bottom.
A Boss Oscillator value over 0,92% (yellow) indicates that the security is OVERBOUGHT and a crossover below that threshold represents a potential sell signal while a value below -0,92% (red) indicates that the security is OVERSOLD and a crossover above that threshold indicates a potential buy signal.
Optimal conditions for considering a short Entry
During an uptrend, sell when you get a short signal: the "Boss Oscillator" (yellow overbought line) drops below 0,92% (higher band) and is turning green.
Optimal conditions for considering a long Entry
During a downtrend, buy when you get a long signal: the "Boss Oscillator" (red oversold line) rises above -0,92% (lower band) and is turning orange.
Triggers for scaling/adding into your position = Keeping in mind that this oscillator on its own is not meant to be the sole reason for taking a trade, here are some triggers you will see for getting into position (preferably with the optimal conditions being met) The Oscillator flips from yellow color into a red slide and vise versa. The Oscillator crosses the midline up or down. The Oscillaor begins going up/down and is crossing the midline levels at 0. The Oscillator shift from one color to the next in the favored direction of the trade you wish to make.
Signs for taking profit and protecting your trade = the Boss Oscillator changes colors at the top or bottom.
초대 전용 스크립트
이 스크립트는 작성자가 승인한 사용자만 접근할 수 있습니다. 사용하려면 요청을 보내고 승인을 받아야 합니다. 일반적으로 결제 후에 승인이 이루어집니다. 자세한 내용은 아래 작성자의 지침을 따르거나 CryptoTradingFrance에게 직접 문의하세요.
트레이딩뷰는 스크립트 작성자를 완전히 신뢰하고 스크립트 작동 방식을 이해하지 않는 한 스크립트 비용을 지불하거나 사용하지 않는 것을 권장하지 않습니다. 무료 오픈소스 대체 스크립트는 커뮤니티 스크립트에서 찾을 수 있습니다.
작성자 지시 사항
THE PRICING IS A SYMBOLIC 0,50$/DAY + or 15$/MONTH. To get your access visit: https://t.me/cryptotradingfrancebot and select "Boss Oscillator"
면책사항
이 정보와 게시물은 TradingView에서 제공하거나 보증하는 금융, 투자, 거래 또는 기타 유형의 조언이나 권고 사항을 의미하거나 구성하지 않습니다. 자세한 내용은 이용 약관을 참고하세요.