INVITE-ONLY SCRIPT
SmartTrade - ALMCorp
Hello everyone! I’d like to introduce my creation—the Smart Trade indicator. I’ve identified certain patterns and discovered that specific moving averages, at certain deviations, can have a strong impact on price. So, what does this indicator do?
It uses the daily timeframe as the basis for displaying levels. For each cryptocurrency, a unique deviation coefficient is calculated for each level. Essentially, we take two deviation zones—the buy zone and the sell zone—treating them as 0 and 1, respectively. From there, we can plot internal levels based on the Fibonacci sequence.
To summarize:
The indicator displays two main zones (buy/sell).
It also shows internal Fibonacci levels, which exert strong influence on price movements.
For convenience, each level is marked with its corresponding numerical value.

Key Levels for Altcoins: The 0.25–0.5 Range and Imbalance
For many altcoins, the most critical levels are 0.25 and 0.5. Prices tend to stay within this range most of the time—breaking beyond these levels signals a market imbalance, which is usually short-lived.
Example Scenario:
Normal Movement: Price moves between 0.25 (support) and 0.5 (resistance).
Downside Break (Imbalance): If price falls below 0.25 into the buy zone (green area), the failure to hold 0.25 creates a strong imbalance. This typically forces price back up into its usual range.
Upside Break (Imbalance): Similarly, if price breaks above 0.5 (e.g., reaching 0.75), this also creates imbalance, and price tends to revert back down into its standard range.
Conclusion:
Most altcoins trade primarily between 0.25 and 0.5.
A breakout in either direction usually results in a temporary imbalance, which the market quickly corrects.
By recognizing these patterns, we can make more informed trading decisions.

Visualizing Imbalances – From Small to Large
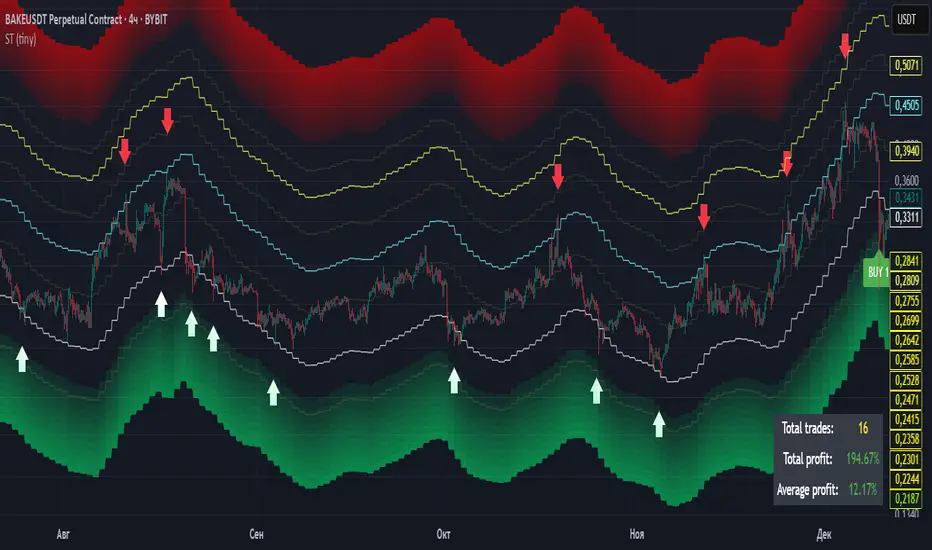
In the chart above, I’ve highlighted all imbalances, ranging from minor to major.
Why This Indicator is Perfect for Spot Trading
I’ve developed a trading strategy for this indicator that displays:
Buy signals (with entry zones)
Average entry price
Sell signals
How the Buy Signals Work:
BUY 1 – Triggered when price touches the upper boundary of the buy zone.
BUY 2 – Activated when price reaches the middle of the buy zone.
BUY 3 – Executed when price tests the lower boundary of the buy zone.
This structured approach ensures you capitalize on optimal entry points while managing risk.

Understanding the Average Entry Line & Profit-Taking System
You may have noticed an additional line on the chart above, displayed alongside the buy signals. This is the average entry line, which represents your mean entry price—calculated based on executing equal-sized purchases at each buy signal (BUY 1, BUY 2, BUY 3).
Where to Sell? Smart Profit-Taking Rules
While precise entries are critical, knowing when to exit is equally important. Here’s how the system works:
Primary Take-Profit Level (0.375)
Historically, this level offers the optimal balance for quick profit-taking.
Adaptive Exit Strategy
If the position is unprofitable by the time of closure, the system automatically shifts the exit to the next higher level (0.5).
This ensures you lock in greater gains when the market favors your trade.


Advanced Performance Tracking & Asset Selection
The indicator provides comprehensive trade analytics, displayed in the bottom-right information panel:
Trade count tracking (total number of executed trades)
Cumulative profitability (combined returns across all trades)
Average profitability per trade (total returns ÷ trade count)
How to Leverage This Data
These metrics allow you to:
Identify high-potential assets
Example: Asset A shows 5% average profit/trade vs. Asset B with 40% → prioritize Asset B for spot trading.
Filter for optimal volatility
Higher average profitability often correlates with stronger momentum/volatility.
Multi-Market Utility
While designed for spot trading, the indicator’s imbalance detection (described earlier) also works for:
Futures market analysis
Entry point identification

It uses the daily timeframe as the basis for displaying levels. For each cryptocurrency, a unique deviation coefficient is calculated for each level. Essentially, we take two deviation zones—the buy zone and the sell zone—treating them as 0 and 1, respectively. From there, we can plot internal levels based on the Fibonacci sequence.
To summarize:
The indicator displays two main zones (buy/sell).
It also shows internal Fibonacci levels, which exert strong influence on price movements.
For convenience, each level is marked with its corresponding numerical value.
Key Levels for Altcoins: The 0.25–0.5 Range and Imbalance
For many altcoins, the most critical levels are 0.25 and 0.5. Prices tend to stay within this range most of the time—breaking beyond these levels signals a market imbalance, which is usually short-lived.
Example Scenario:
Normal Movement: Price moves between 0.25 (support) and 0.5 (resistance).
Downside Break (Imbalance): If price falls below 0.25 into the buy zone (green area), the failure to hold 0.25 creates a strong imbalance. This typically forces price back up into its usual range.
Upside Break (Imbalance): Similarly, if price breaks above 0.5 (e.g., reaching 0.75), this also creates imbalance, and price tends to revert back down into its standard range.
Conclusion:
Most altcoins trade primarily between 0.25 and 0.5.
A breakout in either direction usually results in a temporary imbalance, which the market quickly corrects.
By recognizing these patterns, we can make more informed trading decisions.
Visualizing Imbalances – From Small to Large
In the chart above, I’ve highlighted all imbalances, ranging from minor to major.
Why This Indicator is Perfect for Spot Trading
I’ve developed a trading strategy for this indicator that displays:
Buy signals (with entry zones)
Average entry price
Sell signals
How the Buy Signals Work:
BUY 1 – Triggered when price touches the upper boundary of the buy zone.
BUY 2 – Activated when price reaches the middle of the buy zone.
BUY 3 – Executed when price tests the lower boundary of the buy zone.
This structured approach ensures you capitalize on optimal entry points while managing risk.
Understanding the Average Entry Line & Profit-Taking System
You may have noticed an additional line on the chart above, displayed alongside the buy signals. This is the average entry line, which represents your mean entry price—calculated based on executing equal-sized purchases at each buy signal (BUY 1, BUY 2, BUY 3).
Where to Sell? Smart Profit-Taking Rules
While precise entries are critical, knowing when to exit is equally important. Here’s how the system works:
Primary Take-Profit Level (0.375)
Historically, this level offers the optimal balance for quick profit-taking.
Adaptive Exit Strategy
If the position is unprofitable by the time of closure, the system automatically shifts the exit to the next higher level (0.5).
This ensures you lock in greater gains when the market favors your trade.
Advanced Performance Tracking & Asset Selection
The indicator provides comprehensive trade analytics, displayed in the bottom-right information panel:
Trade count tracking (total number of executed trades)
Cumulative profitability (combined returns across all trades)
Average profitability per trade (total returns ÷ trade count)
How to Leverage This Data
These metrics allow you to:
Identify high-potential assets
Example: Asset A shows 5% average profit/trade vs. Asset B with 40% → prioritize Asset B for spot trading.
Filter for optimal volatility
Higher average profitability often correlates with stronger momentum/volatility.
Multi-Market Utility
While designed for spot trading, the indicator’s imbalance detection (described earlier) also works for:
Futures market analysis
Entry point identification
초대 전용 스크립트
이 스크립트는 작성자가 승인한 사용자만 접근할 수 있습니다. 사용하려면 요청을 보내고 승인을 받아야 합니다. 일반적으로 결제 후에 승인이 이루어집니다. 자세한 내용은 아래 작성자의 지침을 따르거나 ALEKSEI_MAKSIMOV에게 직접 문의하세요.
트레이딩뷰는 스크립트 작성자를 완전히 신뢰하고 스크립트 작동 방식을 이해하지 않는 한 스크립트 비용을 지불하거나 사용하지 않는 것을 권장하지 않습니다. 무료 오픈소스 대체 스크립트는 커뮤니티 스크립트에서 찾을 수 있습니다.
작성자 지시 사항
For access, message us in TradingView chat or Telegram.
💡 Обсуждаем торговые идеи , делимся индикаторами и стратегиями в нашем Telegram-чате:
👉 t.me/+AQWwxRhhrXI0YTgy
👉 t.me/+AQWwxRhhrXI0YTgy
면책사항
이 정보와 게시물은 TradingView에서 제공하거나 보증하는 금융, 투자, 거래 또는 기타 유형의 조언이나 권고 사항을 의미하거나 구성하지 않습니다. 자세한 내용은 이용 약관을 참고하세요.