PROTECTED SOURCE SCRIPT
Neural Network Crawl

About the Indicator
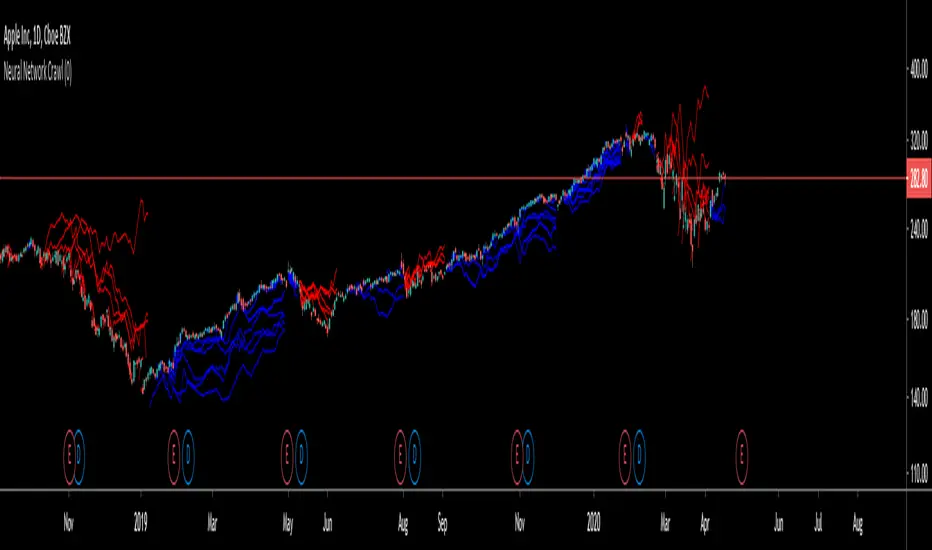
The Crawling Neural Network is a unique algorithm that identifies clusters of random walks that are crossing above or below the market price of the asset.
The random walks always exist, but the specific series that contribute to the cluster can only be seen during their significant period.
When the price trends strongly in a direction, it is more likely that it will traverse a significant amount of random walks and form a cluster.
The random walks are derived from a random selection of logarithmic movements in the last 200 bars and have been spawned at the beginning of price history.
Additionally, if you add the indicator to your chart multiple times and change the modifier in the settings panel, you can view more random walks that contribute to the clusters as seen in the screenshot below.

This indicator is available to everyone. Enjoy...
The Crawling Neural Network is a unique algorithm that identifies clusters of random walks that are crossing above or below the market price of the asset.
The random walks always exist, but the specific series that contribute to the cluster can only be seen during their significant period.
When the price trends strongly in a direction, it is more likely that it will traverse a significant amount of random walks and form a cluster.
The random walks are derived from a random selection of logarithmic movements in the last 200 bars and have been spawned at the beginning of price history.
Additionally, if you add the indicator to your chart multiple times and change the modifier in the settings panel, you can view more random walks that contribute to the clusters as seen in the screenshot below.
This indicator is available to everyone. Enjoy...
보호된 스크립트입니다
이 스크립트는 비공개 소스로 게시됩니다. 하지만 이를 자유롭게 제한 없이 사용할 수 있습니다 – 자세한 내용은 여기에서 확인하세요.
Kenzing trading indicators for TradingView perform advanced real-time analysis of stock price trends and display alerts that are easy for the average Trader to interpret.
kenzing.com
kenzing.com
면책사항
해당 정보와 게시물은 금융, 투자, 트레이딩 또는 기타 유형의 조언이나 권장 사항으로 간주되지 않으며, 트레이딩뷰에서 제공하거나 보증하는 것이 아닙니다. 자세한 내용은 이용 약관을 참조하세요.