INVITE-ONLY SCRIPT
GODXBT PIVOTS
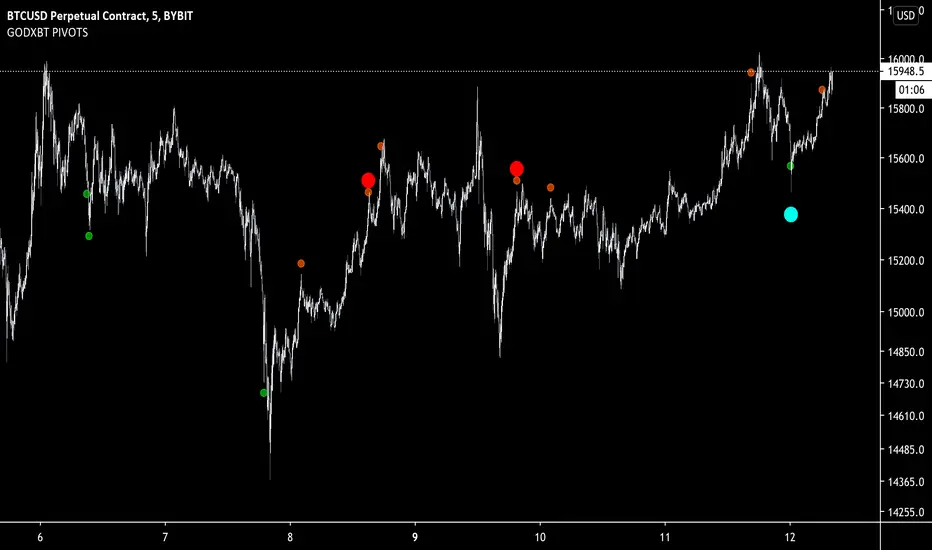
Pivot points script shows the overbought and oversold conditions from oscillators
Overbought conditions have two types
1. Orange dots indicates mild overbought condition
2. Red dots indicates extreme overbought condition
Same thing for Oversold conditions
1. Green dots shows mild oversold conditions
2. Blue dots shows extreme oversold conditions
These conditions indicates the possibilities of a reversal
Signal confirmation on the bar close
Best to use for taking profits and built a position step by step (ladder position)
Dm for the access
초대 전용 스크립트
이 스크립트는 작성자가 승인한 사용자만 접근할 수 있습니다. 사용하려면 요청을 보내고 승인을 받아야 합니다. 일반적으로 결제 후에 승인이 이루어집니다. 자세한 내용은 아래 작성자의 지침을 따르거나 GODFATHER711에게 직접 문의하세요.
트레이딩뷰는 스크립트 작성자를 완전히 신뢰하고 스크립트 작동 방식을 이해하지 않는 한 스크립트 비용을 지불하거나 사용하지 않는 것을 권장하지 않습니다. 무료 오픈소스 대체 스크립트는 커뮤니티 스크립트에서 찾을 수 있습니다.
작성자 지시 사항
면책사항
이 정보와 게시물은 TradingView에서 제공하거나 보증하는 금융, 투자, 거래 또는 기타 유형의 조언이나 권고 사항을 의미하거나 구성하지 않습니다. 자세한 내용은 이용 약관을 참고하세요.