OPEN-SOURCE SCRIPT
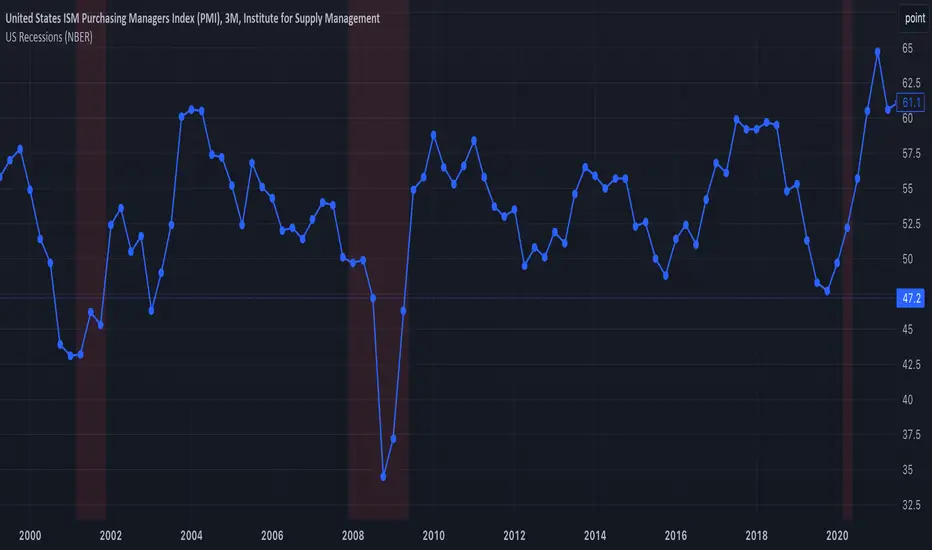
US Recessions (NBER)
This indicator is designed to replace the US Recessions indicator.
Unfortunately, the original indicator is now broken, and the author is not responding: tradingview.com/v/csfFrTe4/ .
There are other similar indicators, but they are not based on live data and either show non-officially recognized recessions or fail to display all officially recognized recessions.
This indicator shades US recession periods based on live monthly data from USREC. It highlights all officially recognized US recessions according to the NBER and will automatically shade any future recessions when they occur. The indicator works across all timeframes, correctly shading recessions whether you are viewing a 30-minute, 2-hour, daily, weekly, or any other chart timeframe.
Warning & Risks:
This indicator uses the barmerge.lookahead_on option to correctly handle monthly recession data from USREC. The purpose of this setting is to ensure that the monthly data points are applied retroactively to the corresponding bars on the chart. However, this means that while past recession periods are accurately shaded, the script is effectively displaying data from future candles and plotting it backward onto the chart.
This behavior does not introduce a “future leak” in the traditional sense—since USREC data is backward-looking and the current month always remains non-recessionary until officially confirmed. Nonetheless, it can cause confusion, as users may see recession periods shaded retroactively only after the data becomes available. Therefore, the current month will always appear non-recessionary until the next data point is released, and historical recession periods may be adjusted after the fact.
오픈 소스 스크립트
트레이딩뷰의 진정한 정신에 따라, 이 스크립트의 작성자는 이를 오픈소스로 공개하여 트레이더들이 기능을 검토하고 검증할 수 있도록 했습니다. 작성자에게 찬사를 보냅니다! 이 코드는 무료로 사용할 수 있지만, 코드를 재게시하는 경우 하우스 룰이 적용된다는 점을 기억하세요.
면책사항
해당 정보와 게시물은 금융, 투자, 트레이딩 또는 기타 유형의 조언이나 권장 사항으로 간주되지 않으며, 트레이딩뷰에서 제공하거나 보증하는 것이 아닙니다. 자세한 내용은 이용 약관을 참조하세요.
오픈 소스 스크립트
트레이딩뷰의 진정한 정신에 따라, 이 스크립트의 작성자는 이를 오픈소스로 공개하여 트레이더들이 기능을 검토하고 검증할 수 있도록 했습니다. 작성자에게 찬사를 보냅니다! 이 코드는 무료로 사용할 수 있지만, 코드를 재게시하는 경우 하우스 룰이 적용된다는 점을 기억하세요.
면책사항
해당 정보와 게시물은 금융, 투자, 트레이딩 또는 기타 유형의 조언이나 권장 사항으로 간주되지 않으며, 트레이딩뷰에서 제공하거나 보증하는 것이 아닙니다. 자세한 내용은 이용 약관을 참조하세요.