PROTECTED SOURCE SCRIPT
OGT Trend Dashboard
What Is The OGT Trend Dashboard?
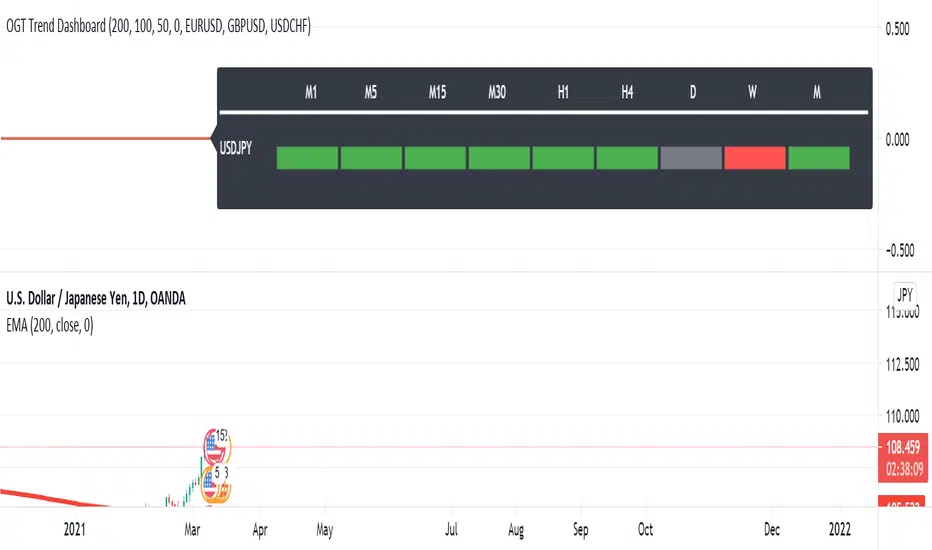
The One Glance Trader (OGT) Trend Dashboard is a trend indicator that visualises if a stock, currency pair etc. is trending (up/down) on multiple time frames. The aim of the dashboard is to provide a "one glance" view for a custom list of symbols to show a clear trend bias. A green timeframe signals it is in a up trend, red for a down trend and grey for no clear trend direction. The indicator uses 3 EMAs (fast, medium slow) to define whether a symbol is trending or ranging. The 3 EMAs periods can be defined by the user.
Indicator Settings
- Fast, medium and slow EMA periods
- Symbols (up to 4 can be selected). First symbol will always be the chart the indicator is applied to
- Alerts - select for all symbols you want alerts so (historic alerts for the first symbol will be visually applied on the chart)
- Timeframes ( M1 to Monthly)
Alerts - You can create alerts for any of the 4 pairs when all timeframes selected are trending up (green) or down (red).
How To Use the OGT Trend Dashboard
- Entry Signal For Trends: When all desired timeframes are either trending up/down enter the market in the direction of the trend
- Determine Trend Bias: Use the dashboard to complement existing trend trading systems as added confirmation
보호된 스크립트입니다
이 스크립트는 비공개 소스로 게시됩니다. 하지만 이를 자유롭게 제한 없이 사용할 수 있습니다 – 자세한 내용은 여기에서 확인하세요.
면책사항
해당 정보와 게시물은 금융, 투자, 트레이딩 또는 기타 유형의 조언이나 권장 사항으로 간주되지 않으며, 트레이딩뷰에서 제공하거나 보증하는 것이 아닙니다. 자세한 내용은 이용 약관을 참조하세요.
보호된 스크립트입니다
이 스크립트는 비공개 소스로 게시됩니다. 하지만 이를 자유롭게 제한 없이 사용할 수 있습니다 – 자세한 내용은 여기에서 확인하세요.
면책사항
해당 정보와 게시물은 금융, 투자, 트레이딩 또는 기타 유형의 조언이나 권장 사항으로 간주되지 않으며, 트레이딩뷰에서 제공하거나 보증하는 것이 아닙니다. 자세한 내용은 이용 약관을 참조하세요.