OPEN-SOURCE SCRIPT
업데이트됨 Jurik Price Bands and Range Box [BigBeluga]
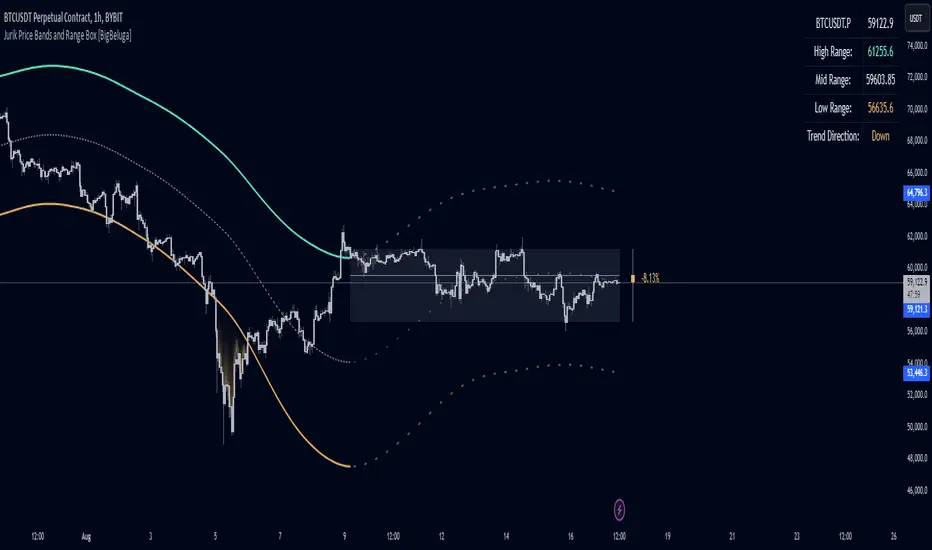
Jurik Price Bands and Range Box
The Jurik Price Bands and Range Box - BigBeluga indicator is an advanced technical analysis tool that combines Jurik Moving Average (JMA) based price bands with a dynamic range box. This versatile indicator is designed to help traders identify trends, potential reversal points, and price ranges over a specified period.
🔵KEY FEATURES
● Jurik Price Bands

● Dynamic Range Box
● Price Position Indicator

● Dashboard

🔵HOW TO USE
● Trend Identification

● Potential Reversal Points

● Range Analysis

🔵CUSTOMIZATION
The Jurik Price Bands and Range Box indicator offers several customization options:
By fine-tuning these settings, traders can adapt the indicator to various market conditions and personal trading strategies.
The Jurik Price Bands and Range Box indicator provides a multi-faceted approach to market analysis, combining trend identification, potential reversal point detection, and range analysis in one comprehensive tool. The use of Jurik Moving Average offers a smoother, more responsive alternative to traditional moving averages, potentially providing more accurate signals.
This indicator can be particularly useful for traders looking to understand market context quickly, identify potential reversal points, and assess current market volatility. The combination of dynamic bands, range analysis, and the informative dashboard provides traders with a rich set of data points to inform their trading decisions.
As with all technical indicators, it's recommended to use the Jurik Price Bands and Range Box in conjunction with other forms of analysis and within the context of a well-defined trading strategy. While this indicator provides valuable insights, it should be considered alongside other factors such as overall market conditions, volume, and fundamental analysis when making trading decisions.
The Jurik Price Bands and Range Box - BigBeluga indicator is an advanced technical analysis tool that combines Jurik Moving Average (JMA) based price bands with a dynamic range box. This versatile indicator is designed to help traders identify trends, potential reversal points, and price ranges over a specified period.
🔵KEY FEATURES
● Jurik Price Bands
- Utilizes Jurik Moving Average for smoother, more responsive bands
Pine Script® //@function Calculates Jurik Moving Average //@param src (float) Source series //@param len (int) Length parameter //@param ph (int) Phase parameter //@returns (float) Jurik Moving Average value jma(src, len, ph) => var float jma = na var float e0 = 0.0 var float e1 = 0.0 var float e2 = 0.0 phaseRatio = ph < -100 ? 0.5 : ph > 100 ? 2.5 : ph / 100 + 1.5 beta = 0.45 * (len - 1) / (0.45 * (len - 1) + 2) alpha = math.pow(beta, phaseRatio) e0 := (1 - alpha) * src + alpha * nz(e0[1]) e1 := (src - e0) * (1 - beta) + beta * nz(e1[1]) e2 := (e0 + phaseRatio * e1 - nz(jma[1])) * math.pow(1 - alpha, 2) + math.pow(alpha, 2) * nz(e2[1]) jma := e2 + nz(jma[1]) jma - Consists of an upper band, lower band, and a smooth price line
- Bands adapt to market volatility using Jurik MA on ATR
- Helps identify potential trend reversal points and overextended market conditions
● Dynamic Range Box
- Displays a box representing the price range over a specified period
- Calculates high, low, and mid-range prices
- Option for adaptive mid-range calculation based on average price
- Provides visual representation of recent price action and volatility
● Price Position Indicator
- Shows current price position relative to the mid-range
- Displays percentage difference from mid-range
- Color-coded for quick trend identification
● Dashboard
- Displays key information including current price, range high, mid, and low
- Shows trend direction based on price position relative to mid-range
- Provides at-a-glance market context
🔵HOW TO USE
● Trend Identification
- Use the middle of the Range Box as the primary trend reference point
- Price above the middle of the Range Box indicates an uptrend
- Price below the middle of the Range Box indicates a downtrend
- The bar on the right shows the percentage distance of the close from the middle of the box
- This percentage indicates both trend direction and strength
- Refer to the dashboard for quick trend direction confirmation
● Potential Reversal Points
- Upper and lower Jurik Bands can indicate potential trend reversal points
- Price reaching or exceeding these bands may suggest overextended conditions
- Watch for price reaction at these levels for possible trend shifts or pullbacks
- Range Box high and low can serve as additional reference points for price action
● Range Analysis
- Use Range Box to gauge recent price volatility and trading range
- Mid-range line can act as a pivot point for short-term price movements
- Percentage difference from mid-range helps quantify price position strength
🔵CUSTOMIZATION
The Jurik Price Bands and Range Box indicator offers several customization options:
- Adjust Range Box length for different timeframe analysis
- Toggle between standard and adaptive mid-range calculation
Standard:
Adaptive: - Modify Jurik MA length and deviation for band calculation
- Toggle visibility of Jurik Bands
By fine-tuning these settings, traders can adapt the indicator to various market conditions and personal trading strategies.
The Jurik Price Bands and Range Box indicator provides a multi-faceted approach to market analysis, combining trend identification, potential reversal point detection, and range analysis in one comprehensive tool. The use of Jurik Moving Average offers a smoother, more responsive alternative to traditional moving averages, potentially providing more accurate signals.
This indicator can be particularly useful for traders looking to understand market context quickly, identify potential reversal points, and assess current market volatility. The combination of dynamic bands, range analysis, and the informative dashboard provides traders with a rich set of data points to inform their trading decisions.
As with all technical indicators, it's recommended to use the Jurik Price Bands and Range Box in conjunction with other forms of analysis and within the context of a well-defined trading strategy. While this indicator provides valuable insights, it should be considered alongside other factors such as overall market conditions, volume, and fundamental analysis when making trading decisions.
릴리즈 노트
Update Visuality of Bands overlay over a box range.오픈 소스 스크립트
트레이딩뷰의 진정한 정신에 따라, 이 스크립트의 작성자는 이를 오픈소스로 공개하여 트레이더들이 기능을 검토하고 검증할 수 있도록 했습니다. 작성자에게 찬사를 보냅니다! 이 코드는 무료로 사용할 수 있지만, 코드를 재게시하는 경우 하우스 룰이 적용된다는 점을 기억하세요.
🔵Gain access to our powerful tools : bigbeluga.com/tv
🔵Join our free discord for updates : bigbeluga.com/discord
All scripts & content provided by BigBeluga are for informational & educational purposes only.
🔵Join our free discord for updates : bigbeluga.com/discord
All scripts & content provided by BigBeluga are for informational & educational purposes only.
면책사항
해당 정보와 게시물은 금융, 투자, 트레이딩 또는 기타 유형의 조언이나 권장 사항으로 간주되지 않으며, 트레이딩뷰에서 제공하거나 보증하는 것이 아닙니다. 자세한 내용은 이용 약관을 참조하세요.
오픈 소스 스크립트
트레이딩뷰의 진정한 정신에 따라, 이 스크립트의 작성자는 이를 오픈소스로 공개하여 트레이더들이 기능을 검토하고 검증할 수 있도록 했습니다. 작성자에게 찬사를 보냅니다! 이 코드는 무료로 사용할 수 있지만, 코드를 재게시하는 경우 하우스 룰이 적용된다는 점을 기억하세요.
🔵Gain access to our powerful tools : bigbeluga.com/tv
🔵Join our free discord for updates : bigbeluga.com/discord
All scripts & content provided by BigBeluga are for informational & educational purposes only.
🔵Join our free discord for updates : bigbeluga.com/discord
All scripts & content provided by BigBeluga are for informational & educational purposes only.
면책사항
해당 정보와 게시물은 금융, 투자, 트레이딩 또는 기타 유형의 조언이나 권장 사항으로 간주되지 않으며, 트레이딩뷰에서 제공하거나 보증하는 것이 아닙니다. 자세한 내용은 이용 약관을 참조하세요.