OPEN-SOURCE SCRIPT
M2 Global Liquidity Index (Candles)
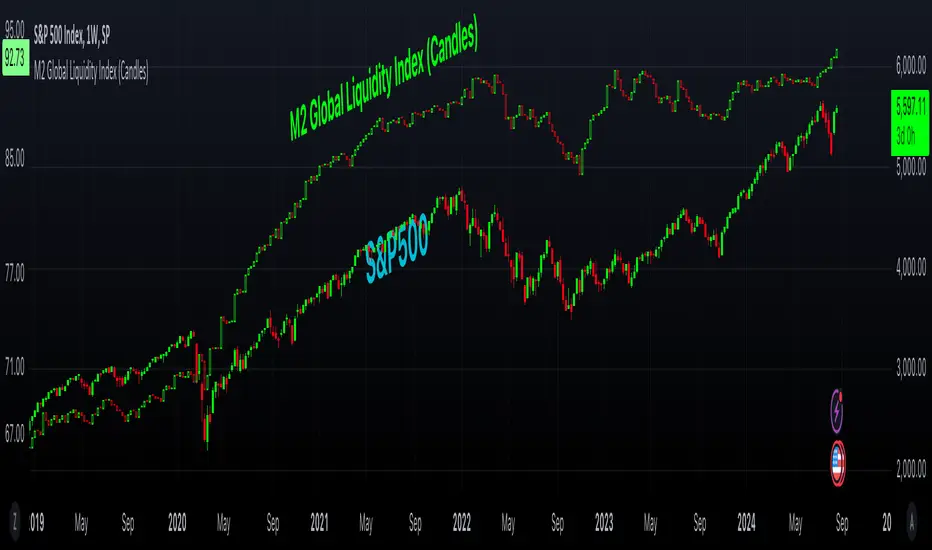
M2 Global Liquidity Index (Candles)
In this enhanced version of the original M2 Global Liquidity Index script by Mik3Christ3ns3n, I've taken the foundational concept and expanded its capabilities for more in-depth analysis and user flexibility. This updated script aggregates M2 money supply data from major global economies—China, the U.S., the Eurozone, Japan, and the U.K.—adjusted by their respective exchange rates, into a customizable global liquidity index.
Key Enhancements:
Candlestick Visualization:
• Instead of a simple line chart, I've implemented a candlestick chart, providing a more detailed representation of liquidity trends with open, high, low, and close values for each period. This allows traders to analyze the index with the same technical tools used for price charts.
Customizable Components:
• Users can now select which components (M2 data and exchange rates) to include in the index calculation, giving you the flexibility to tailor the index to specific economic factors or regions of interest.
Dynamic Color Coding:
• Candles are color-coded based on their performance (bullish or bearish), with customized wick and border colors to enhance visual clarity, making it easier to spot liquidity trends at a glance.
Overlay Option:
• This script is designed to be an overlay, allowing you to plot the Global Liquidity Index directly on your price charts, facilitating comparison between liquidity trends and asset prices.
This enhanced script is ideal for traders and analysts who want a deeper understanding of global liquidity trends and their impact on financial markets.
오픈 소스 스크립트
트레이딩뷰의 진정한 정신에 따라, 이 스크립트의 작성자는 이를 오픈소스로 공개하여 트레이더들이 기능을 검토하고 검증할 수 있도록 했습니다. 작성자에게 찬사를 보냅니다! 이 코드는 무료로 사용할 수 있지만, 코드를 재게시하는 경우 하우스 룰이 적용된다는 점을 기억하세요.
면책사항
해당 정보와 게시물은 금융, 투자, 트레이딩 또는 기타 유형의 조언이나 권장 사항으로 간주되지 않으며, 트레이딩뷰에서 제공하거나 보증하는 것이 아닙니다. 자세한 내용은 이용 약관을 참조하세요.
오픈 소스 스크립트
트레이딩뷰의 진정한 정신에 따라, 이 스크립트의 작성자는 이를 오픈소스로 공개하여 트레이더들이 기능을 검토하고 검증할 수 있도록 했습니다. 작성자에게 찬사를 보냅니다! 이 코드는 무료로 사용할 수 있지만, 코드를 재게시하는 경우 하우스 룰이 적용된다는 점을 기억하세요.
면책사항
해당 정보와 게시물은 금융, 투자, 트레이딩 또는 기타 유형의 조언이나 권장 사항으로 간주되지 않으며, 트레이딩뷰에서 제공하거나 보증하는 것이 아닙니다. 자세한 내용은 이용 약관을 참조하세요.