OPEN-SOURCE SCRIPT
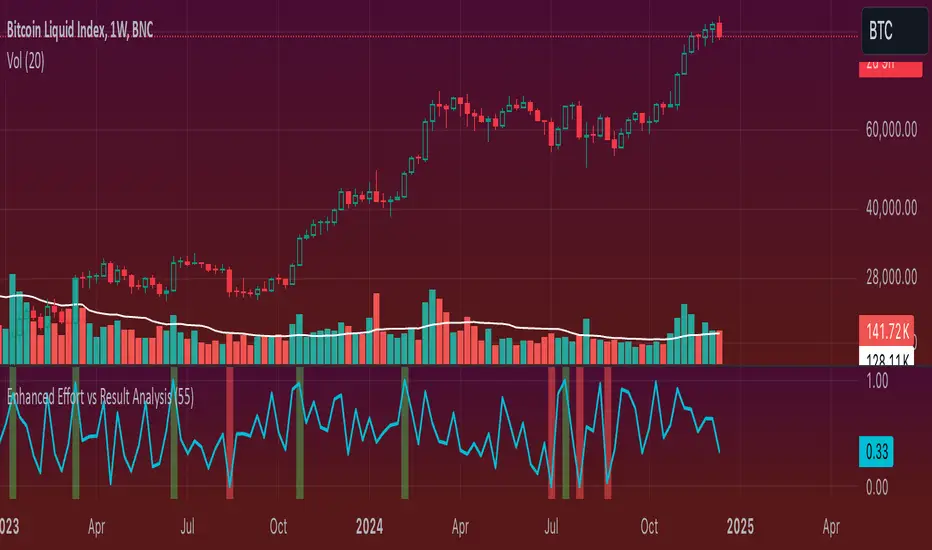
Enhanced Effort vs Result Analysis V.2
How to Use in Trading
A. Confirm Breakouts
Check if the Effort-Result Ratio or Z-Score spikes above the Upper Band or Z > +2:
Suggests a strong, efficient price move.
Supports breakout continuation.
B. Identify Reversal or Exhaustion
Look for Effort-Result Ratio or Z-Score dropping below the Lower Band or Z < -2:
Indicates high effort but low price movement (inefficiency).
Often signals potential trend reversal or consolidation.
C. Assess Efficiency of Trends
Use Relative Efficiency Index (REI):
REI near 1 during a trend → Confirms strength (efficient movement).
REI near 0 → Weak or inefficient movement, likely signaling exhaustion.
D. Evaluate Volume-Price Relationship
Monitor the Volume-Price Correlation:
Positive correlation (+1): Confirms price is driven by volume.
Negative correlation (-1): Indicates divergence; price moves independently of volume (potential warning signal).
3. Example Scenarios
Scenario 1: Breakout Confirmation
Effort-Result Ratio spikes above the Upper Band.
Z-Score exceeds +2.
REI approaches 1.
Volume-Price Correlation is positive (near +1).
Action: Strong breakout confirmation → Trend continuation likely.
Scenario 2: Reversal or Exhaustion
Effort-Result Ratio drops below the Lower Band.
Z-Score is below -2.
REI approaches 0.
Volume-Price Correlation weakens or turns negative.
Action: Signals trend exhaustion → Watch for reversal or consolidation.
Scenario 3: Range-Bound Market
Effort-Result Ratio stays within the Bollinger Bands.
Z-Score remains between -1 and +1.
REI fluctuates around 0.5 (neutral efficiency).
Volume-Price Correlation hovers near 0.
Action: Normal conditions → Look for breakout signals before acting.
*IMPORTANT*
There is a problem with the overlay ... How to fix some of it
The Standard Deviation bands dont work while the other variable activated so Id suggest deselecting them. The fix for this is to make sure you have the background selected and by doing this it will highlight on the chart ( you may need to increase the opacity ) when the bands ( Second standard deviation) are touched.
- Also you can use them all at once if you can but you do not need to
오픈 소스 스크립트
트레이딩뷰의 진정한 정신에 따라, 이 스크립트의 작성자는 이를 오픈소스로 공개하여 트레이더들이 기능을 검토하고 검증할 수 있도록 했습니다. 작성자에게 찬사를 보냅니다! 이 코드는 무료로 사용할 수 있지만, 코드를 재게시하는 경우 하우스 룰이 적용된다는 점을 기억하세요.
면책사항
해당 정보와 게시물은 금융, 투자, 트레이딩 또는 기타 유형의 조언이나 권장 사항으로 간주되지 않으며, 트레이딩뷰에서 제공하거나 보증하는 것이 아닙니다. 자세한 내용은 이용 약관을 참조하세요.
오픈 소스 스크립트
트레이딩뷰의 진정한 정신에 따라, 이 스크립트의 작성자는 이를 오픈소스로 공개하여 트레이더들이 기능을 검토하고 검증할 수 있도록 했습니다. 작성자에게 찬사를 보냅니다! 이 코드는 무료로 사용할 수 있지만, 코드를 재게시하는 경우 하우스 룰이 적용된다는 점을 기억하세요.
면책사항
해당 정보와 게시물은 금융, 투자, 트레이딩 또는 기타 유형의 조언이나 권장 사항으로 간주되지 않으며, 트레이딩뷰에서 제공하거나 보증하는 것이 아닙니다. 자세한 내용은 이용 약관을 참조하세요.