OPEN-SOURCE SCRIPT
Volume Anomaly Detector
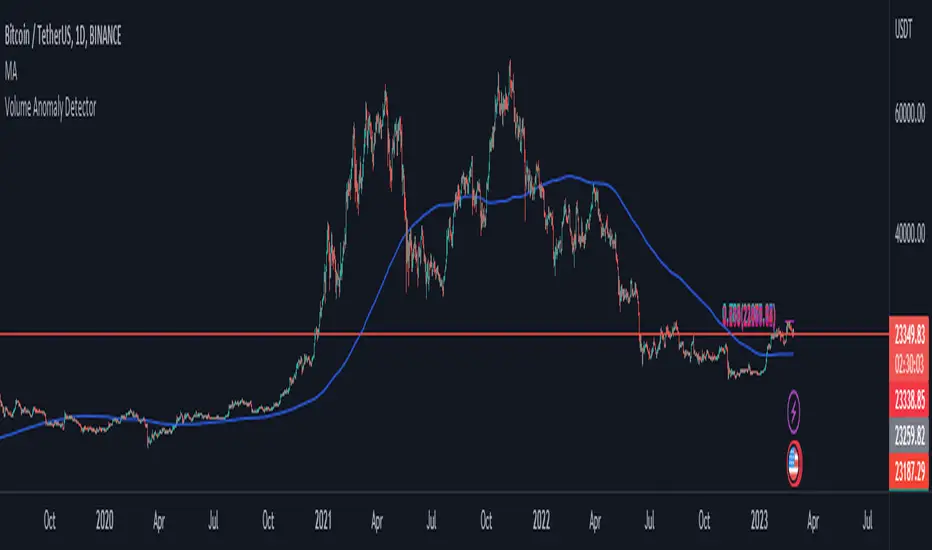
This indicator is designed to detect volume anomalies such as block orders, large institutional orders, and sweep orders. It works by comparing the current volume to the moving average of volume and identifying deviations that exceed a specified threshold. By detecting anomalous volume, it can help traders identify potential market-moving events and anticipate changes in price direction.
One key difference between this indicator and others is its focus on volume anomalies rather than just overall volume or price movements. This can provide traders with additional insights into market conditions and help them identify trading opportunities that may not be visible using other indicators.
In terms of timeframe and market conditions, this indicator can be used on any timeframe and in any market where volume data is available. However, it may be particularly useful in markets with high liquidity and significant institutional participation, such as equities and futures markets. It may also be most effective during periods of heightened volatility or when significant news or events are expected to impact the market. As with any trading indicator, it's important to use it in conjunction with other tools and analysis to confirm signals and make informed trading decisions.
오픈 소스 스크립트
트레이딩뷰의 진정한 정신에 따라, 이 스크립트의 작성자는 이를 오픈소스로 공개하여 트레이더들이 기능을 검토하고 검증할 수 있도록 했습니다. 작성자에게 찬사를 보냅니다! 이 코드는 무료로 사용할 수 있지만, 코드를 재게시하는 경우 하우스 룰이 적용된다는 점을 기억하세요.
면책사항
해당 정보와 게시물은 금융, 투자, 트레이딩 또는 기타 유형의 조언이나 권장 사항으로 간주되지 않으며, 트레이딩뷰에서 제공하거나 보증하는 것이 아닙니다. 자세한 내용은 이용 약관을 참조하세요.
오픈 소스 스크립트
트레이딩뷰의 진정한 정신에 따라, 이 스크립트의 작성자는 이를 오픈소스로 공개하여 트레이더들이 기능을 검토하고 검증할 수 있도록 했습니다. 작성자에게 찬사를 보냅니다! 이 코드는 무료로 사용할 수 있지만, 코드를 재게시하는 경우 하우스 룰이 적용된다는 점을 기억하세요.
면책사항
해당 정보와 게시물은 금융, 투자, 트레이딩 또는 기타 유형의 조언이나 권장 사항으로 간주되지 않으며, 트레이딩뷰에서 제공하거나 보증하는 것이 아닙니다. 자세한 내용은 이용 약관을 참조하세요.